Open datasets
CAMBER ships a reviewed catalog of open building datasets that it knows how to download,
verify, normalize and analyse. Pick a dataset, and CAMBER fetches it from its publisher, ingests it
into a Parquet store, and writes a config so camber run, camber report and camber drift work
on it straight away. Labelled datasets can then be scored: how many of the known faults did the
rules find, and how many false alarms did they raise?
CAMBER redistributes none of the data. The catalog (camber/datasets/catalog.json, package data)
records where each dataset is published, its licence and citation, and the size and SHA-256 of
every file; camber datasets fetch downloads the files from the publisher onto your machine.
A synthetic entry (0.103) is the one exception: CAMBER generates its data on
your machine instead.
Status: 0.86 shipped the first seven entries and the command-line workflow; 0.89 adds the research-only tier, manual-download entries, Excel workbooks (the
xlsxextra), Brick-grouped ingest, the real-building source layouts below and 14 more entries. 0.96 adds the local catalog UI,camber lab; 0.97 adds the re-tuning workbook, exercises run on these datasets. The Python API (camber.datasets) is provisional -- see API-STABILITY.md.
Quick start
camber datasets list
camber datasets info lbnl-sdahu
camber datasets fetch lbnl-sdahu                       # ~608 MB, verified
camber datasets ingest lbnl-sdahu --store lab_store
camber datasets config lbnl-sdahu --store lab_store --out sdahu.json
camber report sdahu.json --out sdahu.html
camber datasets score lbnl-sdahu --store lab_store
The same from Python:
from camber import datasets

datasets.fetch("lbnl-sdahu")
datasets.ingest("lbnl-sdahu", "lab_store")
datasets.config_template("lbnl-sdahu", "lab_store", out="sdahu.json")
print(datasets.score("lbnl-sdahu", "lab_store")["overall"])
The lab (camber lab)
camber lab is the same workflow in a browser, for learning and teaching:
camber lab --store lab_store # then open the URL it prints (.../lab?token=...)
New to it? Using the lab walks through a first session step by step, then covers reading the trends and the report, disk use and cleanup, setting up a class, and troubleshooting.
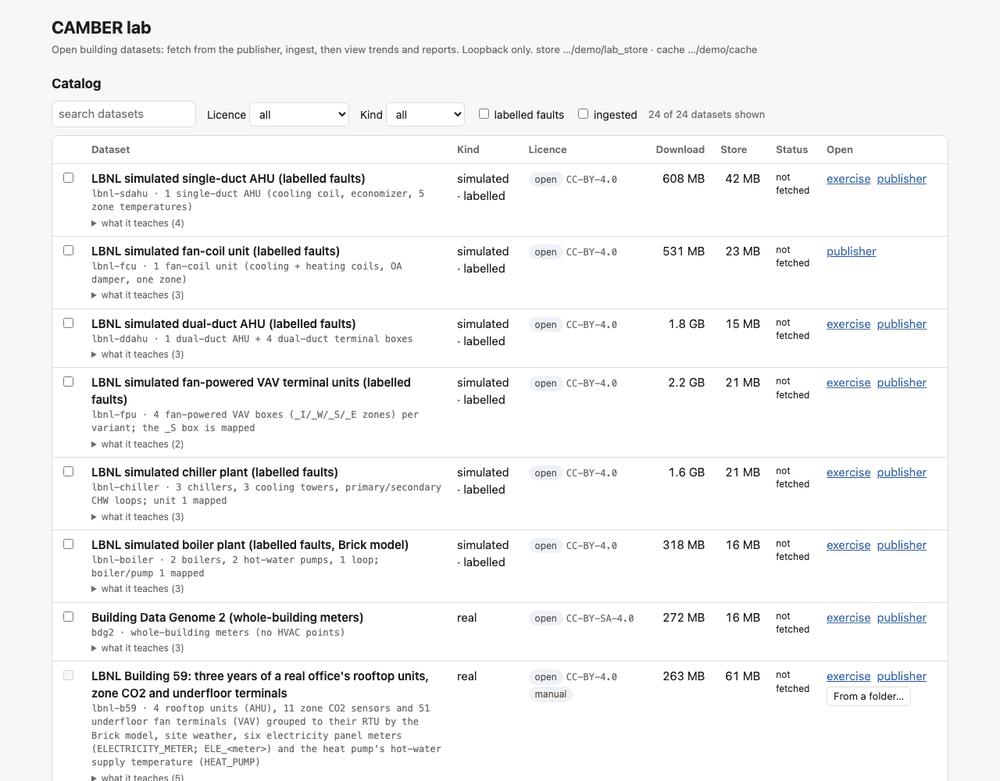
The camber lab catalog page on an empty store: each dataset's kind, licence tier, download and store sizes, status, and its exercise and publisher links. A manual download has a From a folder… button.
The catalog table. Each dataset shows its kind, its licence tier (a green open badge,
or a red research-only one), its download size and its estimated size once ingested. It also
shows what is already fetched or ingested. Filter by licence tier, kind, labelled faults or
ingested, and search by id, title or what the dataset teaches (each row's what it teaches
list is collapsed until you open it, or until your search matches it; 0.96, #78). Pick a subset (default or
full) and tick datasets. The page adds up what they need (0.103, #123): the download still to
fetch, the archive members the ingest extracts into the cache, and the store estimate, each with
the fetch's own 5 % headroom. It compares the cache's needs with the free space on the cache's
disk and the store's with the store's disk, or their sum when both are one disk. Fetch &
ingest is disabled while the selection does not fit, and Ingest (already fetched) while its
extraction and store do not. The server runs the same check before it queues a job (not
enough disk space, HTTP 507). A row whose requires_extras names an extra that is not installed
shows it in red with the install command and cannot be ticked; the server refuses its fetch or
ingest (409) before anything is downloaded.
Jobs. A fetch (and the ingest that follows it) runs as a job on a single background worker, one job at a time, with a progress bar, a log line and a Cancel button. A cancelled download keeps its partial file, so the next fetch resumes it. A cancelled ingest leaves the store as it was. When a job finishes, the page shows the dataset's citation. Please cite it. force re-ingest (next to Ingest (already fetched)) re-ingests data whose inputs have not changed, which an ingest otherwise skips.
Remove and ingest from a folder (0.103, #123). Remove… in a row does what camber datasets
remove does: after you type the dataset id, a job deletes the dataset's downloads and
extractions from the cache, and, when you tick it, drops its facilities from the store
(--purge-store). In a workspace the purge respects the facility lifecycle: a facility under a
legal hold, or one that is suspended, offboarding or archived, is not purged, and the dialog says
why. A manual entry's From a folder… does what camber datasets ingest --from-dir does. It
takes the absolute path of a folder with the files you downloaded. The lab checks that the folder
exists and refuses a file that links outside it. It only reads the folder, then verifies the
files, copies them into the cache and ingests them. Using the lab shows
both.
Research-only datasets. Selecting one opens a dialog that states the licence terms. You tick
I accept and type the dataset id; only then is the fetch queued. The acceptance is recorded
in acknowledgements.json, exactly like --accept-noncommercial (with via: "lab fetch"): in
the cache's, or in your own when the cache is read-only (see
a read-only shared cache).
Every fetch asks again. An ingest of data already fetched with an acknowledgement does not.
Trends and reports. An ingested dataset's row links to:
- trends: the live trend viewer (
/ui?facility_id=ds-<id>, served unchanged fromcamber serve; one panel per unit with axes, a legend and a normalised view, see the live web UI); - report: the audit report of the dataset's config template, built on demand and cached until the data changes. It carries the dataset's Data source & licence block, the evidence charts of its worst findings (0.103) and, for research-only data, the non-commercial / do-not-redistribute banner;
- publisher: the publisher's landing page;
- exercise: the dataset's workbook exercise, when the entry names one (served offline by the lab from a source checkout, else linked on the docs site).
With a portfolio workspace (camber lab --workspace W, or $CAMBER_PORTFOLIO), a dataset's
facility goes through the lifecycle:
- Its first ingest registers
ds-<id>asprovisioning. The ingest runs under the workspace's single-writer lock, and the facility is activated afterwards. - Every fetch, acknowledgement and ingest appends a
lab.fetch,lab.acknowledgeorlab.ingestline to the audit log; an ingest from a folder addslab.adopt, a removallab.removeand each purged facilitylab.purge.camber portfolio auditshows them next to thefacility.addandfacility.activatelines. - Retention, offboarding and archiving then apply to it as to any facility. A suspended,
offboarding or archived dataset facility is not re-ingested, nor purged from the lab: resume or
restore it first, or retire it with
camber facility offboard|archive|purge.
Without a workspace, the lab writes to a plain store (--store, default ./lab_store).
Security. The lab binds 127.0.0.1 only, and it answers only requests addressed to
127.0.0.1 or localhost. Every page and request needs this run's access token: open the
launch URL camber lab prints (http://127.0.0.1:8765/lab?token=..., also saved in a launch
file only you can read), and the browser keeps a session cookie for it (0.102). Other accounts
on a shared computer get 401. It accepts writes only from its own page, which also sends a
per-run CSRF token with each one. The only writes it accepts are queueing (fetch, ingest, ingest
from a folder, remove) or cancelling a job, for catalog ids.
The full list is in SECURITY.md. From
Python, camber.lab.LabApp and make_lab_server are the (provisional) API.
The catalog
| id | what | kind | labelled | licence | default subset |
|---|---|---|---|---|---|
lbnl-sdahu |
single-duct AHU, 21 runs | simulated | yes | CC-BY-4.0 | 8 runs + a spliced onset run |
lbnl-fcu |
fan-coil unit, 49 runs | simulated | yes | CC-BY-4.0 | 4 runs |
lbnl-ddahu |
dual-duct AHU, 56 runs | simulated | yes | CC-BY-4.0 | 3 runs |
lbnl-fpu |
fan-powered VAV boxes (parallel + series), 62 runs | simulated | yes | CC-BY-4.0 | 5 runs |
lbnl-chiller |
chiller plant, 24 runs | simulated | yes | CC-BY-4.0 | 4 runs |
lbnl-boiler |
boiler plant, 17 runs, Brick model | simulated | yes | CC-BY-4.0 | 4 runs |
bdg2 |
3,053 whole-building meters, 19 sites | real | no | CC-BY-SA-4.0 | 10 sites x up to 4 buildings |
lbnl-b59 |
real office: 4 rooftop units with measured OA flow, 11 zone CO2 sensors, 51 underfloor terminals, 15-minute electricity panel meters, Brick model (manual download) | real | no | CC-BY-4.0 | RTUs, CO2 zones, weather and meters, 3 years |
valladolid-uva |
2 university buildings, Spain: hourly whole-building electricity 2016-2020 with daily weather; the published SEP chaining case | real | no | CC-BY-4.0 | both buildings |
finnish-dcv |
laboratory office room with occupancy-based DCV and ground-truth counts | lab | no | CC-BY-4.0 | all 3 files |
b4b-windesheim |
3 office rooms, two CO2 sensors each, ventilation valve, PIR | real | no | CC-BY-4.0 | all 5 runs |
nuig-ahu101 |
lecture-theatre AHU (100% outdoor air) + room + weather, 14 months at 1 min | real | no | CDLA-Permissive-1.0 | the one unit |
irish-ahu |
industrial mixing-box AHU, 5.5 years at 15 min | real | no | CC-BY-4.0 | the one unit |
nist-heatpump-fdd |
residential heat pumps, cooling-mode lab test points, 60 runs (xlsx extra) |
lab | yes | NIST-PD | 8 runs |
nist-ibal |
lab chiller with refrigerant pressures, 10 s (manual download) | lab | no | NIST-PD | 11 days |
robod |
5 rooms, Singapore: CO2, outdoor-air flow, occupancy (weekdays only) | real | no | CC-BY-4.0 | all 5 rooms |
sdu-ou44 |
3 rooms, Denmark: CO2, VAV damper, occupant counts (44 shuffled days) | real | no | CC0-1.0 | all 3 rooms |
ornl-frp-ops |
1 RTU + 10 VAV boxes, 7 operating scenarios, 1-minute | real | no | CC-BY-4.0 | RTU, weather and all 10 boxes x 2 scenarios |
ornl-supermarket-fdd |
CO2 booster refrigeration rack, 6 faults (reference only) | lab | yes | CC-BY-4.0 | 2 fault / baseline pairs |
ornl-frp-vav |
one RTU + 10 VAV boxes, 31 one-day tests | real | yes | CC-BY-4.0 | one damper test set (7 days) |
rbc-g36-ahu |
AHU + 5 VAV zones, G36 and rule-based control, 414 runs | simulated | yes | CC-BY-4.0 (research-only: see Licences) | 8 runs |
at-30bldg-sensors |
1,832 raw sensors, 30 buildings, 23 months | real | no | CC-BY-NC-SA-4.0 (research-only) | 3 buildings |
cofactor-drammen |
45 Norwegian public buildings (schools, kindergartens, nursing homes, offices): hourly electricity import, sub-meters and district heat, 4 years | real | no | CC-BY-4.0 | every building's import meters (48 meters) |
bts |
BTS: 3 Australian buildings, ~20,000 Brick-labelled BMS streams, 2021-2023 (0.96) | real | no | CC-BY-4.0 | the metadata and Brick models of all 3 sites + site B's streams (1.5 GB) |
synthetic-hw-plant-lockout |
synthetic, generated by CAMBER: one hot-water plant as 4 scenario plants (warm-weather lockout), 8 weeks hourly (0.103) | synthetic | yes | Apache-2.0 (CAMBER's own) | all 4 plants (generated, about 0.3 MB) |
camber datasets info <id> prints the full entry: publisher, citation and DOI, what it teaches,
the subsets and their download sizes, and the entry's known issues.
Workbook exercises (0.97, provisional). An entry used by the
re-tuning workbook names its exercise in suggested_analyses.exercise:
either a page of the docs, as its path under docs/ (workbook/<exercise-id>.md, optionally
with #<anchor>), or an https URL. The catalog check rejects anything else. camber datasets
info <id> prints the published URL, and the lab links it: to its own
offline copy of the page when it runs from a source checkout (or --docs DIR), else to the docs
site. Where the dataset's default config does not fit an exercise, the exercise ships its own
template in camber/datasets/configs/exercises/<exercise-id>.json, which names the dataset it
was tuned for ("_dataset") and is written the usual way:
camber datasets config <id> --exercise <exercise-id> --store DIR --out cfg.json.
Every entry has a default subset (small enough to try -- small in bytes: at most 100 MB once
ingested, whatever its run count, since a real building's runs are its equipment) and a full
one. A subset selects the files to download and, for labelled datasets, the runs to ingest; for
bdg2 it selects sites, meters and a cap on buildings per site, for at-30bldg-sensors the
buildings (groups). Choose one with --subset full.
Licences
Each entry carries an SPDX licence id and a licence tier (access), shown by
camber datasets list:
- open -- the licence allows commercial use (CC0, CC-BY, CC-BY-SA, CDLA-Permissive-1.0, US
federal public-domain data such as NIST's,
NIST-PD, ...). Fetch it freely; cite the publisher. A share-alike licence (BDG2 is CC-BY-SA-4.0) additionally means a redistributed adaptation of the data must keep the same licence -- analysing it, including commercially, is fine. Reports built from share-alike data say so. - research-only (
access: "research_only") -- the licence is non-commercial (NC) or no-derivatives (ND), or CAMBER holds an open-licence entry here for a statedaccess_reason. You may download and analyse the data for research, but not use it commercially or redistribute it (or anything built from it). CAMBER makes that an explicit act: fetchrefuses it unless you pass--accept-noncommercial-- on every fetch; there is no environment-variable bypass. The acceptance is appended toacknowledgements.jsonin the cache (and to the manifest) before anything downloads. Against a cache you cannot write, it goes to your own ledger instead (see a read-only shared cache).fetch --allcovers the open tier only; research-only entries need--licence alland--accept-noncommercial.ingestneeds an acknowledgement of the entry's current licence (from the fetch, or its own--accept-noncommercial), and recordsredistribution: "prohibited"on the facility.- Every report built from the data -- audit, RCx, drift, site report, dashboard -- carries a non-commercial / do-not-redistribute banner.
A stated reason. rbc-g36-ahu's record is CC BY 4.0, but its archive bundles a folder of
ASHRAE 1312-RP data (01_RBC-ASHRAE1312) whose open licence CAMBER cannot vouch for. The folder is
never ingested, and the maintainer holds the whole entry research-only with an access_reason,
which the licence gate's refusal, camber datasets info, the facility's provenance
(access_reason) and every report's banner and source block show in place of the licence claim.
The entry's data issue bundled-1312-rp-folder describes the folder.
The catalog validator enforces that an NC or ND licence is always research_only (it can never be
labelled open, with or without a reason), that an open-licence entry is research_only only with
a non-empty access_reason, and that access_reason appears nowhere else; and that every URL is
HTTPS. Files are pinned (size + SHA-256) unless an entry says why not.
Synthetic datasets
Some faults appear in no open dataset: a boiler left enabled through a warm spell, a hot-water
pump left running all summer. A synthetic entry (kind: "synthetic", 0.103) lets a learner
work such a case through the normal lab and workbook flow. Its data is not downloaded:
CAMBER's own generator (camber.datasets._synthetic, named by the entry's generator with a
fixed seed) writes it into the cache when you fetch it, and the same seed gives the same bytes
on every machine. From there it is ingested like any other entry, into a ds-<id> facility
whose equipment are <equip>__<scenario>.
camber datasets fetch synthetic-hw-plant-lockout # generates the file; nothing is downloaded
camber datasets ingest synthetic-hw-plant-lockout --store lab_store
(ingest also generates the file when it is not in the cache yet.) What differs from a
downloaded entry:
- No download, no pin. The entry's files carry no URL, size or SHA-256. The generator's name,
version and seed are the pin, recorded in the manifest with
source: "generated".--from-dirdoes not apply, and the maintainers' refresh and link checks skip the entry. - CAMBER's own licence. The data is generated by your copy of CAMBER, so it carries CAMBER's licence, Apache-2.0, in the open tier: you may share it and anything built from it.
- Labelled synthetic everywhere.
camber datasets listshows its kind assynthetic, its download asgeneratedand a[synthetic: generated locally]note;infonames the generator and seed; the lab shows a synthetic badge and a Kind: synthetic filter; and every report built from it has a "synthetic data" banner and asynthetic:line in its "Data source & licence" block. It describes no real building: never cite its figures as evidence about one. - Still validated. The catalog check requires a known generator, exactly the files that generator writes, no download fields, CAMBER's licence, the open tier and no manual download.
The one entry so far, synthetic-hw-plant-lockout, is the dataset of the workbook exercise
plant-lockout: one weather series (eight weeks from early May with
a warm spell) driving four plants (OAT, burner firing and gas input, hot-water pump status and
speed, loop supply and return temperatures): PLANT__locked_out, PLANT__warm_spell,
PLANT__pump_left_on and PLANT__low_lockout. Its run template runs boiler_summer_lockout and
hw_pump_summer_lockout at the default 65 °F lockout.
Manual downloads
Some publishers hand files out only through a portal with terms to accept. Such an entry is
manual: true with manual_instructions; CAMBER never downloads it (fetch exits 1 with the
instructions; fetch --all skips it). Download the files yourself, then:
camber datasets ingest <id> --from-dir ~/Downloads/<publisher files> --store lab_store
--from-dir finds each catalog file under the directory by its catalog path, then by its bare
name, verifies every pinned file (size + SHA-256; a mismatch is refused with exit code 2 and
your file is left untouched), hashes unpinned ones with a warning, and hard-links (or copies) them
into the cache, recorded in the manifest as source: "local" -- from then on status, remove
and re-ingest treat them like fetched files. --from-dir works for any entry whose files you
already have. A research-only manual entry also needs --accept-noncommercial. In camber lab, a
manual entry's From a folder… button does the same (0.103).
Running the workbook answer checks on local files
The workbook's answer checks run on the real catalog data with
pytest -m network tests/workbook. By default they download what they need. To use files you
already have, point CAMBER_WORKBOOK_FROM_DIR at a directory that holds them; the checks then
ingest with --from-dir, so pinned files are still size- and SHA-256-verified:
CAMBER_WORKBOOK_FROM_DIR=<dir> CAMBER_WORKBOOK_STORE=<store> \
pytest -m network tests/workbook -k plant-cooling-tower
- Layout. Put each dataset's files in a
<dir>/<dataset-id>/subfolder (<dir>/lbnl-b59/Building_59.zip). When that subfolder does not exist,<dir>itself is searched. A file is found by its catalog path or its bare catalog name. - Names. Files must carry their catalog names. A copy saved under another name (a checkout's
examples/_datahasLBNL_Chiller_Plant.zipforLBNL_FDD_Data_Sets_Chiller_Plant.zip) is not found, so build the directory from symlinks with the catalog names. - Manual downloads.
lbnl-b59is never fetched. DownloadBuilding_59.zipandREADME_Dryad_Bldg59.txtfrom its Dryad page (camber datasets info lbnl-b59prints the instructions) into<dir>/lbnl-b59/. Without them, and without an earlier ingest in the cache, its exercises are skipped with a message naming the missing files. - Store.
CAMBER_WORKBOOK_STOREkeeps the ingested store between runs; a dataset already ingested there from the same inputs and mapping is not ingested again.
The files the exercises need, per dataset:
b4b-windesheim:preprocessed_data/b4b_preprocess_properties.zip,metadata/b4b-room-metadata.zip,README.mdbdg2:metadata.csv,weather.csv,cleaned/electricity_cleaned.csv,cleaned/chilledwater_cleaned.csvcofactor-drammen:Cofactor_Drammen_Buildings_45_v3.zipfinnish-dcv:training_data_1.csv,training_data_2.csv,ventilation_test.csvirish-ahu:Data_Article_Dataset.csvlbnl-b59(manual):Building_59.zip,README_Dryad_Bldg59.txtlbnl-boiler:LBNL_FDD_Data_Sets_Boiler_Plant.zip,LBNL_FDD_Data_Sets_Boiler_Plant_ttl.ziplbnl-chiller:LBNL_FDD_Data_Sets_Chiller_Plant.zip,LBNL_FDD_Data_Sets_Chiller_Plant_ttl.ziplbnl-ddahu:LBNL_FDD_Data_Sets_DDAHU.zip,LBNL_FDD_Data_Sets_DDAHU_ttl.ziplbnl-fpu:LBNL_FDD_Data_Sets_FPU.zip,LBNL_FDD_Data_Sets_FPU_ttl.ziplbnl-sdahu:LBNL_FDD_Data_Sets_SDAHU.zip,LBNL_FDD_Data_Sets_SDAHU_ttl.zipnuig-ahu101:nuig-data.tar.gz,NUIG_variables_MR1_MP5_AHU101 focus v1.xlsxornl-frp-ops:Building_Base_Heating.csv,Weather_Base_Heating.csv,Building_SB_Heating.csv,Weather_SB_Heating.csvornl-frp-vav:Set_03_Damper Tests_Room 205.xlsxsdu-ou44:Dataset.zipvalladolid-uva:db_building_A.csv,db_building_B.csv
The small *_ttl.zip Brick files of the LBNL sets are separate catalog downloads; fetch them
with camber datasets fetch <id> if a local copy lacks them. A test keeps this list in step with
the catalog.
Excel workbooks (the xlsx extra)
A few publishers ship .xlsx workbooks. Reading them needs the optional extra:
pip install "camber-toolkit[xlsx]" # openpyxl, imported only when a workbook is read
Such an entry lists "requires_extras": ["xlsx"] (the validator requires it whenever a run reads a
workbook), and ingest stops with that install command when the extra is missing. camber lab
shows the extra on the entry's row and, when it is missing, refuses the fetch before downloading
anything (0.103). A run names its
worksheet with "sheet" (default: the first). Legacy .xls files are not covered by the extra:
the only one published beside a planned entry (a heat-pump test report's appendix) is a transposed
steady-state summary table, not time-series data, so the entry does not use it. CAMBER reads an
.xls only if you install xlrd yourself.
Brick-grouped ingest
Some datasets publish one wide table per quantity (every air handler's supply temperature in
one file) and a Brick model saying which point belongs to which equipment. A run with
"group": "brick" is split by the entry's ingest.brick model instead of becoming one equipment:
- each column is a Brick point (matched by name); its role comes from the Brick class (mapped and alias classes only -- ambiguous points are left out);
- its equipment is the point's owner (
brick:hasPoint, or the inversebrick:isPointOf), or the first entity up thehasPart/isPartOfchain whose Brick classequip_classesmaps to a CAMBER class ({"Rooftop_Unit": "AHU"}); points with no such owner go to the run's ownequip/class; - the dataset's mapping file wins: its
aliasesoverride a column's role, its"equipment": {column: equip}the owner and its"equipment_classes": {equip: class}the class; each override is listed in the ingest notes.
Columns of several unlabelled files merge into one equipment per owner, so every per-quantity file contributes to the same air handler.
Source layouts
Measured datasets rarely come as one wide table per scenario. Each layout has one key, validated by
camber.datasets (validate_catalog) and read by one code path (camber/datasets/_readers.py):
- Several files per run --
"members": a list of per-quantity tables whose columns are joined on the timestamp (lbnl-b59's underfloor terminals), or{raw column: member}for one file per point (nuig-ahu101,sdu-ou44): each member's value -- its last non-clock column, or the second column of a headerlesstimestamp,valueexport -- becomes the named raw column. Only the members a run needs are extracted, and a table several runs share is parsed once. - Rows of a stacked table --
"where": {column: value or [values]}keeps a run's rows (one room ofb4b-windesheim's table, one test's points ofnist-heatpump-fdd's sheet), compared as text, before duplicate stamps are dropped. - A run's own mapping --
"mapping", with"vars"filling{placeholders}in it: one table holding a rooftop unit and ten VAV boxes (ornl-frp-ops) becomes one run per box, each readingT_Room_{n}with its ownn. A run may also carry its owntimestamp_format,units,encodingandsheet(twoornl-supermarket-fddfiles stamp minutes where the others stamp seconds). - Plain equipment names --
"equip_id"stores a run's equipment verbatim instead of<equip>__<scenario>(real, unlabelled data has no scenarios;RTU01_zone_022joinsRTU01through the naming topology). - Several pieces of equipment in one table, no Brick model --
"group": "mapping": the mapping file'sequipment/equipment_classessplit the table (ornl-frp-vav's test sheets into the RTU and its ten boxes). A grouped run's"target"names the equipment under test: only it carries the run's fault label; the rest is recorded as unscoredcontext. Name boxes under their air handler (RTUandRTU_VAV_104) and the naming topology places each scenario's boxes under that scenario's air handler. Aderiveof the form{"column": ..., "copy": ...}hands one building-wide schedule column to every box. - One file per sensor --
"adapter": "per_point"(at-30bldg-sensors): anindextable gives each sensor's group (a building) and class; every group becomes a facilityds-<id>-<group>, every sensor an equipment with one role from the entry'sclass_map, read fromseriesby the same one-point reader. Change-of-value logs are resampled sample-and-hold ("hold": "8h5min": an empty bin holds the last sample while it is at most that old). The subset'sgroupspick the buildings. - One series per Brick point --
"adapter": "brick_streams"(bts, 0.96): each site ("sites": {key: {"model", "index", "series", "source_timezone", "local_timezone"}}) ships a Brick model whose points name their series through a literal (senaps:stream_id), an index table of stream ids and Brick classes, and a zip of numbered series files. Every site becomes a facilityds-<id>-<site>; each point's role comes from its Brick class, its equipment from itsisPointOfowner or the first containing entity whose classequip_classesmaps (named<class>_<id prefix>, since the ids are anonymised), else the site equipment (site_equip). Unmapped and ambiguous points are counted per class in the provenance, never guessed; a second point with the same role on the same owner becomes its own equipment<equip>-2,-3, ... (counted, never averaged). Series files are pickles of numpy arrays, read with a restricted unpickler that resolves only numpy's array globals (a pickle can otherwise run code); only each member's first bytes are read to find its stream, and nothing is extracted to disk. Samples are resampled sample-and-hold ("hold"). The subset'sgroupspick the sites. - Clocks.
timestamp_formatpins the parse (a strftime format, or"ISO8601"for stamps that mix precisions). A source without a wall-clock column declares aclock:{"kind": "elapsed", "unit": "s", "origin": "2025-01-01"}counts from a stated origin (rbc-g36-ahu's simulation seconds);{"kind": "day", "day": ..., "time": ..., "start": ..., "every_days": 7}stores anonymised daydonstart + d * every_days(sdu-ou44);{"kind": "rows", "freq": "1min", "start": ...}numbers a steady-state sheet's rows (nist-heatpump-fdd). Thedayandrowsclocks are synthetic: the ingest notes and the provenance (clock) say so, and rates, schedules and drift over them mean nothing. - Time zones. The store holds naive wall-clock time. A stamp carrying a UTC offset keeps its
wall clock as written (an export that labels local time
+00:00is a data issue on its entry). A dataset published in another clock declaressource_timezone--"UTC", an IANA zone, or"offset"for stamps with true per-row offsets (nist-ibal's-05:00/-04:00) -- andlocal_timezone; the index moves to the site's wall clock after the quirks, so quirk timestamps are in the publisher's clock. A DST fall-back's repeated hour keeps both readings (the resample averages them). - Text encoding --
"encoding"on the spec or a run ("latin-1"). - A metadata preamble --
"header_marker"names the first field of a text file's real header line and every line above it is skipped, however long the block is in each file;"sep"sets the delimiter (cofactor-drammen: akey;valuebuilding block, then unit and description rows, thenTimeStamp;Tout;...). - Units add
psia(converted to psig, CAMBER's refrigerant-pressure unit),psigandm3/min. - Days that are not consecutive --
"contiguous": false(robodhas no weekends,sdu-ou44shuffles its days) is recorded in the provenance; such an entry's template runs no drift, setback or other schedule rule.
Four intake branches built these layouts in parallel before 0.89 reconciled them; the validator rejects their earlier spellings and names the key to use:
| earlier spelling | use |
|---|---|
run "points": {column: member} |
"members": {column: member} |
run "where": {"column": c, "in": [...]} |
"where": {c: [...]} |
"tz_convert": zone |
"source_timezone": "offset" + "local_timezone": zone |
"synthetic_index": {"start", "freq"} |
"clock": {"kind": "rows", ...} |
"day_clock": {...} |
"clock": {"kind": "day", ...} |
"timestamp_unit" + "timestamp_origin" |
"clock": {"kind": "elapsed", "unit", "origin"} |
per_point "points" (the sensor index) |
"index" |
How a dataset lands in the store
- Facility. Each dataset becomes one facility,
ds-<id>(bdg2: one per site,ds-bdg2-<site>). - Scenarios as equipment. Each labelled run becomes an equipment
<equip>__<scenario>of the same class --AHU__fault_free,AHU__damper_stuck_025, ... -- so onecamber runscores every scenario, side by side. - Onset runs. A
splicejoins a fault-free run and a faulted run at an onset date (AHU__onset_damper_stuck_025: healthy until 2018-07-01, stuck damper after) for drift and fault-onset exercises. - Normalization. Only the mapped columns are read; values are resampled to 15 minutes (status points become duty), converted to IP units where the source is metric (°C, L/s, Pa, W, ...), and valve/damper fractions are rescaled to percent. Implausible medians after conversion are reported as warnings.
- Data issues and quirks. Every problem CAMBER knows of in the published data is described
on the entry -- the columns, the evidence, the publisher documentation it contradicts and how
CAMBER handles it (see Data issues below). A fix
is applied before mapping by a declared quirk (the chiller plant's swapped outdoor wet/dry-bulb
and secondary-loop supply/return columns; the single-duct AHU's placeholder static-pressure
values;
lbnl-b59's 2020 meter-column shift, undone by a time-windowedremap, and its HVAC meter dropouts, masked and then refilled by afillfrom the same clock time on nearby days, never across a gap longer than the quirk'smax_run);camber datasets ingest --no-correctionsskips every fix and ingests the data exactly as published, so the two can be compared (use a second store). An annotated problem is left in place; an excluded run is ingested for inspection but never scored. CAMBER's own mistakes (a mapping, an assumed design parameter, a template rule) are simply fixed. - Provenance. The facility's registry entry records, under its
"dataset"key, the licence, citation, DOIs, file checksums, the ingest's content hash, the fault label of every scenario, the runs excluded from scoring, the quirks applied, the data issues and whether corrections were applied. Reports read it to print a Data source & licence block. - Idempotent. Re-running
ingestwith the same inputs is skipped;--force, a different subset or a different corrections mode (the content hash covers it) replaces the dataset's facilities atomically (staged, then swapped in). - Reproducible. Since 0.103, ingesting the same files with the same CAMBER and pyarrow
versions gives byte-identical part files with the same names, in any archive member order; on
another pyarrow version the rows are the same but the bytes may differ. A store ingested
before 0.103 reads the same and is not re-ingested;
ingest --forcerewrites it in the canonical layout. See SCALE.md. - Disk.
camber datasets info <id>shows each subset's download size and its estimated size once ingested;ingestwarns when the store's filesystem has less free space than the estimate for the subset being ingested (afullsubset is many times itsdefault).
Caches, locks and a read-only shared cache
The cache. Downloads go to the dataset cache: --dir, else $CAMBER_DATA_DIR, else
$XDG_CACHE_HOME/camber/datasets, else ~/.cache/camber/datasets. Each dataset has a folder,
<cache>/<id>/downloads/ for the files as published and <cache>/<id>/extracted/ for the
archive members an ingest needed. Beside them are manifest.json (what was fetched, with which
SHA-256), acknowledgements.json (the research-only acceptances) and, since 0.103, _lock.
Locks (0.103). Two processes writing one cache or one store, such as two camber labs or a
lab and camber datasets ingest, no longer get in each other's way:
- every write to a cache holds the cache's single-writer lock,
<cache>/_lock. That covers a fetch that downloads,ingest --from-dirplacing files, an ingest extracting archive members or recording an acknowledgement, andremove; - an ingest, and
remove --purge-store, hold the store's lock for as long as they write it. A plain store's lock is<store>/_lock. A store inside a portfolio workspace uses the workspace's own lock, never a second one, so a command that already holds it (the lab's workspace ingest) carries on without deadlocking; - a second writer waits up to 30 seconds, then stops with an error that names the holder:
dataset cache … is locked by <pid>@<host> since <time>orstore … is locked by …(camber datasetsexits 1; a lab job fails with that message). Run it again once the other job finishes; - reads take no lock:
status, the lab's catalog, trends and reports, andcamber runon the store. Files and partitions are swapped in whole, so a reader sees the old data or the new; - the lock is the kernel's (
flock, ormsvcrton Windows), the same one the portfolio uses. It is released when its process exits, even after a crash orkill -9. A_lockfile left behind is not a stale lock, only stale text, and the next writer takes it over; - advisory locks are unreliable on some network filesystems (older NFS, SMB without byte-range locks). Keep a cache that several machines write on a local disk, or give each machine its own.
The lock covers what camber datasets and camber lab write. Other commands that write a plain
store, such as camber ingest of a CSV export, do not take it.
A read-only shared cache (0.103). A cache that you can read but not write, such as a course folder on a shared drive that one person filled, now works:
- Fetch checks that every file of the subset is present and matches its pinned size and SHA-256. If so, it downloads nothing and writes nothing, not even the manifest; a writable cache whose manifest already records the files is left alone the same way. If a file is missing or does not verify, the fetch stops with the dataset cache … is read-only for this user: ask whoever maintains the cache to fetch it there, or use a cache you can write.
- Ingest reads the downloads where they are. Archive members already extracted in the cache
are used as they are. Members it still needs are extracted into a scratch folder next to the
ingest's staging area in the store (
<store>/_staging/), which is deleted when the ingest ends. So the store's disk needs room for them while the ingest runs, and each ingest extracts them again. To avoid that, whoever fills the cache can ingest each dataset once, which leaves its members extracted there. - Research-only acknowledgements are per user. Against a read-only cache, your
acknowledgement goes to your own ledger,
$XDG_STATE_HOME/camber/datasets/acknowledgements.json(else~/.local/state/camber/datasets/acknowledgements.json). The record names the cache. Only your own ledger counts there: the cache's manifest records the acceptance of the person who filled it, which does not stand in for yours. So the first fetch or ingest of a research-only dataset from a shared cache asks you to accept its terms. A cache you can write keeps its acknowledgements in its ownacknowledgements.jsonand manifest, as before. Everyone who writes a writable shared cache shares those. - What still needs a writable cache: downloading,
ingest --from-dir, andremove. They stop with the read-only message and change nothing.
"Read-only" means the current user cannot create files in the cache folder (or in the dataset's folder inside it).
Scoring
camber datasets score <id> --store DIR runs the entry's config template (or reads
--findings findings.json from camber run --out), maps each scenario's findings to "which
detectors fired", and scores them against the labels with the LBNL FDD evaluation framework:
overall detection (TPR / FPR / accuracy), each target detector against its own fault type, and the
correct-diagnosis rate -- every rate with a Wilson 95% interval. The scored detectors are the
entry's declared targets (e.g. outdoor_air_fraction -> damper for lbnl-sdahu), so context
rules in the template do not move the score.
Data issues and how CAMBER handles them
Each issue below cites the publisher documentation it contradicts by DOI whenever the dataset
has one. A dataset with no DOI (a versioned repository such as b4b-windesheim's) is cited by a
pinned https URL -- one fixed to a commit (.../blob/188573d.../README.md) or a version
(/v1.2/, ?version=3, /records/<id>), never a moving branch or landing page. The catalog
validator enforces exactly this rule.
The catalog links each dataset exactly as its publisher provides it. Every problem
CAMBER knows of in the published data is described below with its evidence, the
publisher documentation it contradicts, and how CAMBER handles it: fix (corrected
at ingest by a declared quirk; camber datasets ingest --no-corrections ingests the
published data as-is), annotate (left in place and recorded in the facility's
provenance), exclude (kept out of scoring or of an analysis) or none (described
only). Nothing is corrected silently. camber datasets info <id> prints the same list.
lbnl-sdahu: LBNL simulated single-duct AHU (labelled faults)
SA_SPSPT is a -400.25 placeholder in every faulted run
- Issue:
sa-spspt-placeholder - Columns:
SA_SPSPT - Evidence: All 20 faulted runs export SA_SPSPT as the constant -400.25; the fault-free run exports the setpoint 1.60746 inH2O.
- Contradicts: SDAHU inventory Table 2 (SA_SPSPT: supply air duct static pressure setpoint, inches H2O) (LBNL FDD Data Sets, doi:10.25984/1881324; Granderson et al. 2023, Sci Data 10:342, doi:10.1038/s41597-023-02197-w)
- Handling: fix -- corrected at ingest (skipped by
--no-corrections). Masked to missing (mask quirk: values below -100), so static-pressure rules decline instead of reading a negative setpoint.
Fault-free SA_SP is the static-pressure setpoint in Pa, not a measurement
- Issue:
sa-sp-fault-free-in-pa - Columns:
SA_SP - Runs:
fault_free - Evidence: Fault-free SA_SP holds 401.9 (median) with the fan off and 403.5 with it on (range 401.8-410.6): the ~1.61 inH2O setpoint expressed in Pa, which never falls toward zero with the fan stopped. In the 20 faulted runs SA_SP is the measured static in inH2O (fan-on median 1.51-1.61, fan-off median 0.003-0.005).
- Contradicts: SDAHU inventory Table 2 (SA_SP: supply air duct static pressure, inches H2O) (LBNL FDD Data Sets, doi:10.25984/1881324; Granderson et al. 2023, Sci Data 10:342, doi:10.1038/s41597-023-02197-w)
- Handling: fix -- corrected at ingest (skipped by
--no-corrections). Masked to missing in the fault-free run (mask quirk: values above 100); the faulted runs' measured static is kept.
SA_CFM and RA_CFM are cfm x 60
- Issue:
sa-ra-cfm-units - Columns:
SA_CFM,RA_CFM - Evidence: SA_CFM peaks at 1,266,232 (RA_CFM 1,264,430) with a fan-on median of 596,187 in the fault-free run -- read as cfm, tens of times any single-floor air handler. Divided by 60 (ft3/h to cfm) they peak at 21,104 cfm (9.96 m3/s) with a 9,936 cfm fan-on median, a plausible floor-level supply. Caveat: at those flows the exported supply-fan power (SF_WAT, at most 1,622 W) is only ~0.08 W/cfm, itself implausibly low, so treat the flow scale with care.
- Contradicts: SDAHU inventory Table 2 (SA_CFM / RA_CFM: supply / return volumetric airflow, CFM) (LBNL FDD Data Sets, doi:10.25984/1881324; Granderson et al. 2023, Sci Data 10:342, doi:10.1038/s41597-023-02197-w)
- Handling: fix -- corrected at ingest (skipped by
--no-corrections). Divided by 60 before mapping (scale quirk) in every run;--no-correctionskeeps the published magnitudes.
OA_CFM is a constant
- Issue:
oa-cfm-constant - Columns:
OA_CFM - Evidence: OA_CFM is 357,730.44 in every row of all 21 runs, fan on or off, damper closed or fully open.
- Contradicts: SDAHU inventory Table 2 (OA_CFM: outdoor volumetric airflow, CFM) (LBNL FDD Data Sets, doi:10.25984/1881324; Granderson et al. 2023, Sci Data 10:342, doi:10.1038/s41597-023-02197-w)
- Handling: exclude -- kept out of scoring / analysis. Not mapped: there is no measured outdoor airflow, so OA fraction is taken from the mixing-box temperature balance.
The simulated calendar runs one weekday late and follows DST
- Issue:
calendar-shifted-one-weekday - Columns:
SYS_CTL,Datetime - Evidence: SYS_CTL (the occupied-mode flag) is 0 on every Monday of 2018 and occupied Tuesday to Sunday: the simulation treats 2018-01-01 (a Monday) as a Sunday, so its Mon-Fri 06-22 schedule falls on Tue-Sat and its Saturday 06-18 on Sunday. The timestamps are standard time but the schedule observes daylight saving: the first occupied minute moves from 06:01 to 05:01 from 2018-03-13 to 2018-11-04 (the first and last occupied days after and before the changes, which fall on unoccupied days). With the fan on and SYS_CTL = 1 the OA damper is never below its 10% minimum (0 of 277,392 rows); every fan-on row with the damper shut has SYS_CTL = 0 (29,364 rows), the unoccupied-mode cycling the inventory describes.
- Contradicts: SDAHU inventory section 1.2 (occupied Monday-Friday 6:00am-10:00pm, Saturday 6:00am-6:00pm) (LBNL FDD Data Sets, doi:10.25984/1881324; Granderson et al. 2023, Sci Data 10:342, doi:10.1038/s41597-023-02197-w)
- Handling: annotate -- left as published and recorded in the provenance. Left as published. SYS_CTL is mapped to the occupancy role, so occupancy-aware rules use the simulation's own schedule instead of CAMBER's assumed Mon-Fri 07-18 office hours; the OA-fraction rule also judges fan-on samples only.
Every run starts at 01:00 on 1 January
- Issue:
first-hour-missing - Columns:
Datetime - Evidence: All 21 runs start at 2018-01-01 01:00 and have 525,540 one-minute rows (a full year is 525,600); damper_stuck_100 runs 2018-04-01 01:00 to 2018-11-01 00:00 (308,101 rows).
- Contradicts: SDAHU inventory section 3 and Table 4 (each file is one year of 1-minute data) (LBNL FDD Data Sets, doi:10.25984/1881324; Granderson et al. 2023, Sci Data 10:342, doi:10.1038/s41597-023-02197-w)
- Handling: annotate -- left as published and recorded in the provenance. Left as published; the first hour of the year is simply absent (the chiller-plant inventory documents the same trimming of simulation start-up).
The four OA-temperature bias runs carry no bias
- Issue:
oa-bias-runs-carry-no-bias - Columns:
OA_TEMP - Evidence: oa_bias_-4/-2/2/4 are byte-identical (same size, 143,313,007 bytes, and CRC-32) and their OA_TEMP is within 0.33 F of the fault-free run in every row (median difference 0.015 F), where a +-2 / +-4 C bias would shift it by 3.6 / 7.2 F.
- Contradicts: SDAHU inventory Tables 3-4 (outdoor air temperature sensor bias of -4, -2, +2 and +4 C) (LBNL FDD Data Sets, doi:10.25984/1881324; Granderson et al. 2023, Sci Data 10:342, doi:10.1038/s41597-023-02197-w)
- Handling: exclude -- kept out of scoring / analysis. Ingested once (the other three are byte-identical copies) and excluded from scoring: they are fault-free replicates, not sensor faults.
The four valve-leak 'severities' are one 10% leak
- Issue:
leak-severities-are-one-10pct-run - Columns:
CHWC_VLV,CHWC_VLV_DM - Evidence: coi_leakage_010/025/040/050 are byte-identical (139,023,633 bytes, same CRC-32). In it the valve position CHWC_VLV is 0.10 (minimum and median) in all 332,140 rows where the demand CHWC_VLV_DM is 0 -- a 10% leak; in the fault-free run the valve reads 0 in 99.6% of its 335,004 zero-demand rows.
- Contradicts: SDAHU inventory Tables 3-4 (cooling coil valve leaking at 10%, 25%, 40% and 50%) (LBNL FDD Data Sets, doi:10.25984/1881324; Granderson et al. 2023, Sci Data 10:342, doi:10.1038/s41597-023-02197-w)
- Handling: exclude -- kept out of scoring / analysis. coi_leakage_010 is the one leak run (its label matches the data); the 025/040/050 copies are excluded from ingest and scoring. There is no leak severity sweep in the published data.
The coi_bias runs are the inventory's supply-air-temperature bias runs
- Issue:
coi-bias-is-supply-air-bias - Columns:
SA_TEMP - Evidence: The archive has coi_bias_-4/-2/2/4 and no sa_bias_* files. OA_TEMP matches the fault-free run exactly (median difference 0.0); the logged SA_TEMP stays at the 55.2 F setpoint in mechanical cooling while the cooling-valve demand moves with the bias sign (medians 0.32 / 0.46 / 0.61 fault-free / 0.77 / 1.00 for -4 / -2 / +2 / +4 C): a supply-air sensor offset the controller holds at setpoint.
- Contradicts: SDAHU inventory Table 4 (sa_bias_-2/-4/2/4_annual.csv: supply air temperature sensor bias) (LBNL FDD Data Sets, doi:10.25984/1881324; Granderson et al. 2023, Sci Data 10:342, doi:10.1038/s41597-023-02197-w)
- Handling: annotate -- left as published and recorded in the provenance. Ingested under the published file names; labelled sensor_bias, described as a supply-air-temperature offset.
lbnl-fcu: LBNL simulated fan-coil unit (labelled faults)
The damper 'stuck at 30%' run is the unit's normal minimum
- Issue:
stuck-at-30-is-normal-operation - Columns:
FCU_DMPR,FCU_MAT - Evidence: The unit's minimum OA damper position is 30%, which is also the fault-free position in 174,453 occupied, fan-on minutes. In OADMPRStuck_30 the occupied fan-on OA fraction is 10.53% (temperature balance) / 10.54% (OA_CFM / supply flow), identical to the fault-free run's 10.53% / 10.54%; the two differ only in unoccupied setback minutes with the fan cycling (10.5% vs 0.2%).
- Contradicts: FCU inventory Table 3 (OA damper stuck at 30%, a fault case) and section 1.2 (minimum damper position 30%) (LBNL FDD Data Sets, doi:10.25984/1881324; Granderson et al. 2023, Sci Data 10:342, doi:10.1038/s41597-023-02197-w)
- Handling: exclude -- kept out of scoring / analysis. Ingested for inspection and excluded from scoring: in the occupied hours every rule judges it is fault-free operation.
The cooling and heating airside-minor-fouling runs are one file
- Issue:
airside-minor-fouling-runs-identical - Columns:
FCU_CVLV_DM,FCU_HVLV_DM - Evidence: FCU_Fouling_Cooling_Airside_Minor.csv and FCU_Fouling_Heating_Airside_Minor.csv are byte-identical (83,997,327 bytes, same CRC-32); the moderate and severe pairs differ. The data cannot say which label is right.
- Contradicts: FCU inventory Table 4 (distinct cooling- and heating-coil airside fouling cases) (LBNL FDD Data Sets, doi:10.25984/1881324; Granderson et al. 2023, Sci Data 10:342, doi:10.1038/s41597-023-02197-w)
- Handling: exclude -- kept out of scoring / analysis. Ingested once under the cooling label (first in the archive); the heating copy is excluded from ingest and scoring.
lbnl-ddahu: LBNL simulated dual-duct AHU (labelled faults)
Table 4 mislabels two stuck-OA-damper severities
- Issue:
stuck-oa-severity-labels - Columns:
OA_DMPR - Evidence: Table 4 lists DualDuct_DMPRStuck_OA_28 as 'Stuck at 20%' and DMPRStuck_OA_45 as 'Stuck at 50%'; Table 3, the file names and the data (fan-on median OA_DMPR 0.28 and 0.45) say 28% and 45% -- the unit's two design minimum positions.
- Contradicts: DDAHU inventory Table 4 (file inventory) vs Table 3 (OA damper stuck at 0, 28, 45, 80 and 100%) (LBNL FDD Data Sets, doi:10.25984/1881324; Granderson et al. 2023, Sci Data 10:342, doi:10.1038/s41597-023-02197-w)
- Handling: annotate -- left as published and recorded in the provenance. Run ids follow the file names (28 / 45), which match the data.
The stuck-OA runs' measured OA does not follow the stuck position
- Issue:
stuck-oa-runs-do-not-follow-the-position - Columns:
OA_CFM,CSA_CFM,HSA_CFM,OA_DMPR - Evidence: Measured OA fraction OA_CFM / (CSA_CFM + HSA_CFM), fan-on medians: DMPRStuck_OA_100 gives 21.3% in Jun-Aug and 42% over the year, where the fault-free unit reaches 95% with its damper fully open (17,723 minutes); DMPRStuck_OA_0 gives 17.9% in Jan, Feb, Apr and Oct-Dec (0.3-1.3% in the other months).
- Contradicts: DDAHU inventory Table 3 (OA damper stuck fully open / fully closed: a fixed simulated device position) (LBNL FDD Data Sets, doi:10.25984/1881324; Granderson et al. 2023, Sci Data 10:342, doi:10.1038/s41597-023-02197-w)
- Handling: annotate -- left as published and recorded in the provenance. Left as published and scored under the published labels; a detector that misses the 'stuck open' run in summer is seeing a unit that brings in 21% OA.
The static-pressure bias runs are labelled 10x too large
- Issue:
static-bias-labels-10x - Columns:
CSA_SP,HSA_SP,CSF_DP,HSF_DP - Evidence: Run ids say +-2 / +-4 in.wg. The logged deck static stays at the 1.6 setpoint (the controller holds the biased reading) and the fan differential pressure moves by the bias: fault-free cold-deck fan DP 2.18 in.wg; CSP +2 / +4 give 1.98 / 1.78 (-0.2 / -0.4), CSP -2 gives 2.38 (+0.2) and CSP -4 also 2.38 (+0.2, not +0.4); HSP -4 / -2 / +2 / +4 move the hot-deck fan DP by +0.40 / +0.20 / -0.20 / -0.41.
- Contradicts: DDAHU inventory Table 4 (sensor bias +-2 / +-4 in.wg) vs Table 3 (-0.4, -0.2, +0.2, +0.4 in.wg) (LBNL FDD Data Sets, doi:10.25984/1881324; Granderson et al. 2023, Sci Data 10:342, doi:10.1038/s41597-023-02197-w)
- Handling: annotate -- left as published and recorded in the provenance. Run ids keep the published names; read them as +-0.2 / +-0.4 in.wg, and SensorBias_CSP_m4inwg as a -0.2 in.wg run.
The 60 F economizer supply-air setpoint is not in the data
- Issue:
economizer-sat-reset-absent - Columns:
CSA_TEMPSPT,CSA_TEMP - Evidence: CSA_TEMPSPT is 55.0 in every row, and in the 89,670 occupied, fan-on economizer minutes (OAT below 60 F, cooling valve shut, outside Jun-Aug) the cold-deck supply temperature itself has a median of 55.0 F.
- Contradicts: DDAHU inventory section 1.2(iii) (economizer cooling mode holds 60 F at the cold deck in the transition season and winter) (LBNL FDD Data Sets, doi:10.25984/1881324; Granderson et al. 2023, Sci Data 10:342, doi:10.1038/s41597-023-02197-w)
- Handling: annotate -- left as published and recorded in the provenance. Left as published: rules comparing the cold deck with its setpoint see a fixed 55 F.
lbnl-fpu: LBNL simulated fan-powered VAV terminal units (labelled faults)
Faults are imposed on the South-zone box, not the West one
- Issue:
faults-on-the-south-box - Columns:
VAV_DMPR_S,RH_VLV_S - Evidence: Diffing each faulted PFPU run against PFPU_FaultFree, the changed columns are the _S ones: averaged over each box's ten points, the median absolute change in VAVDMPRStuck_50pct is 46.7 for the _S box and 0.06-0.07 for the other three. VAV_DMPR_S is a constant 0.50 in VAVDMPRStuck_50pct (each stuck-damper run holds its own position) and RH_VLV_S a constant 0 in ReheatVLVStuck_0pct, while the _W box varies as in the fault-free run.
- Contradicts: FPU inventory section 3 (faults imposed on the west-zone box, variables suffixed _W) (LBNL FDD Data Sets, doi:10.25984/1881324; Granderson et al. 2023, Sci Data 10:342, doi:10.1038/s41597-023-02197-w)
- Handling: annotate -- left as published and recorded in the provenance. The mapping reads the _S box (until 0.82.0 it read the healthy _W box).
The airflow-bias runs log the true flow; the positive offsets appear on the setpoint
- Issue:
airflow-bias-on-the-setpoint-column - Columns:
VAV_PM_CFM_S,VAV_PM_CFM_SP_S - Evidence: Occupied-hour medians: fault-free setpoint and flow 201.3 / 201.3 cfm; SensorBias_VAVAirflow_+400CFM 537.7 / 137.7 and +200CFM 336.2 / 136.0 (the offset sits on the setpoint column); -200CFM and -400CFM keep the 201.3 setpoint while the flow reads 401.3 and 601.2 (the unbiased flow the controller drives up). The logged flow is the true flow in every direction.
- Contradicts: FPU inventory section 2 (for sensor faults the logged value of the faulty sensor is the faulty value) (LBNL FDD Data Sets, doi:10.25984/1881324; Granderson et al. 2023, Sci Data 10:342, doi:10.1038/s41597-023-02197-w)
- Handling: annotate -- left as published and recorded in the provenance. Left as published; the runs are labelled airflow_sensor_bias and scored as airflow_tracking targets (measured flow no longer tracks its setpoint either way).
lbnl-chiller: LBNL simulated chiller plant (labelled faults)
Outdoor dry-bulb and wet-bulb columns are swapped
- Issue:
oa-dry-wet-bulb-swapped - Columns:
OA_TEMP,OA_TEMP_WB - Evidence: Two independent checks. The tower leaving-water setpoint follows max(wet-bulb + 8 F, 60 F): on the 210,661 minutes above the 60 F floor CT_SW_TEMPSPT equals OA_TEMP + 8 to a median 0.28 F but OA_TEMP_WB + 8 only to 6.27 F. The chilled-water reset follows the outdoor dry-bulb: CWL_PRI_SW_TEMPSPT matches the reset of OA_TEMP_WB with a p90 error of 0.49 F (hourly), and the reset of OA_TEMP only to 4.54 F. OA_TEMP_WB also exceeds OA_TEMP in 99.3% of rows, which a wet-bulb cannot do.
- Contradicts: Chiller-plant inventory Table 2 (OA_TEMP: dry bulb; OA_TEMP_WB: wet bulb), Eq. 3 / Table 1 (tower setpoint = wet-bulb + 8 F) and Eq. 2 (the chilled-water reset follows the dry-bulb) (LBNL FDD Data Sets, doi:10.25984/1881324; Granderson et al. 2023, Sci Data 10:342, doi:10.1038/s41597-023-02197-w)
- Handling: fix -- corrected at ingest (skipped by
--no-corrections). Swapped back before mapping (swap quirk), in every run.
Secondary-loop supply and return temperatures are swapped
- Issue:
secondary-supply-return-swapped - Columns:
CWL_SEC_SW_TEMP,CWL_SEC_RW_TEMP - Evidence: In the 169,809 rows where the secondary loop carries load (CWL_SEC_LOAD > 10) the labelled return is colder than the labelled supply in 100% of rows, while the primary loop's return is warmer in 99.9% of them; hourly (supply - return) correlates +0.88 with CWL_SEC_LOAD.
- Contradicts: Chiller-plant inventory Table 2 (CWL_SEC_SW_TEMP: supply, CWL_SEC_RW_TEMP: return water temperature) (LBNL FDD Data Sets, doi:10.25984/1881324; Granderson et al. 2023, Sci Data 10:342, doi:10.1038/s41597-023-02197-w)
- Handling: fix -- corrected at ingest (skipped by
--no-corrections). Swapped back before mapping (swap quirk), in every run; the primary loop is left as published.
The chilled-water reset spans 44-54 F, not 42-52 F
- Issue:
chw-reset-range-44-54 - Columns:
CWL_PRI_SW_TEMPSPT - Evidence: CWL_PRI_SW_TEMPSPT ranges 44.0-54.0 F (54.0 in 327,603 rows, 44.0 in 36,899). Eq. 2 with 44 / 54 F bounds reproduces it from the true dry-bulb to a median 0.00 F (p90 0.49 F, hourly); with the inventory's 42 / 52 F bounds the median error is 2.00 F.
- Contradicts: Chiller-plant inventory Eq. 2 (chilled-water setpoint reset between 42 F and 52 F over 60-80 F outdoor dry-bulb) (LBNL FDD Data Sets, doi:10.25984/1881324; Granderson et al. 2023, Sci Data 10:342, doi:10.1038/s41597-023-02197-w)
- Handling: annotate -- left as published and recorded in the provenance. Left as published; the setpoint is not mapped to a role, and nothing in CAMBER assumes the 42-52 F range.
CHL_STA_1 and CT_STA_1 are enables, not run status
- Issue:
status-points-are-enables - Columns:
CHL_STA_1,CT_STA_1 - Evidence: CHL_STA_1 and CT_STA_1 are 1 in 100% of rows of the fault-free run while chiller 1 draws under 1 kW in 5.5% of rows and tower 1's fan is stopped in 71%; units 2 and 3 read 1 in 12.4% and 0.4% of rows.
- Contradicts: Chiller-plant inventory Table 2 (CHL_STA / CT_STA: on-off status of a chiller / cooling tower) (LBNL FDD Data Sets, doi:10.25984/1881324; Granderson et al. 2023, Sci Data 10:342, doi:10.1038/s41597-023-02197-w)
- Handling: annotate -- left as published and recorded in the provenance. Not mapped: rules that need a chiller or tower run status decline instead of reading the enable as running.
The chiller-fouling runs are not in the inventory
- Issue:
chiller-fouling-runs-undocumented - Columns:
CHL_POW_1 - Evidence: The archive has ChillerPlant_chiller_fouling_065.csv and _095.csv, which Tables 3-4 do not list. Against the fault-free run chiller 1's annual energy rises 61% (065) and 6.3% (095); chiller 2's falls 3.5% / rises 0.2%.
- Contradicts: Chiller-plant inventory Tables 3-4 (21 faulted cases; no chiller fouling) (LBNL FDD Data Sets, doi:10.25984/1881324; Granderson et al. 2023, Sci Data 10:342, doi:10.1038/s41597-023-02197-w)
- Handling: annotate -- left as published and recorded in the provenance. Ingested and scored as chiller_fouling, marked undocumented; the severity is read from the file name by analogy with the tower-fouling runs (heat-transfer coefficient x 0.65 / 0.95), which the inventory does not confirm.
The condenser-bypass runs are fixed, physically implausible bypasses, and the two 75% runs are one case
- Issue:
condenser-bypass-runs-implausible - Columns:
CDWL_SW_TEMP,CDWL_RW_TEMP,TWV_CTRL,CT_FLOW_1,CDWL_CW_FLOW - Runs:
bypass_leakage_025,bypass_leakage_050,bypass_leakage_075,bypass_stuck_050,bypass_stuck_075 - Evidence: Over the minutes a chiller runs, the condenser-loop supply temperature CDWL_SW_TEMP has a p90 of 118.8 / 133.8 / 140.2 F and a maximum of 141.9 / 155.6 / 162.4 F in the 025 / 050 / 075 leakage runs, and is above 100 F in 29.5% / 41.1% / 51.1% of those minutes (the stuck runs give the same p90 and maximum as the leakage run of the same severity); the fault-free run never exceeds 85.8 F. The share of condenser flow that bypasses the towers, 1 - (CT_FLOW_1 + CT_FLOW_2 + CT_FLOW_3) / CDWL_CW_FLOW, is fixed all year at 0.917 / 0.967 / 0.988 (the fault-free run modulates it, p10 0.005 to p90 0.969), and the share estimated from the mixing temperatures equals it to 0.001, so the 25 / 50 / 75 in the file names are not bypassed-flow fractions. The valve command TWV_CTRL reads 0.0 in every one of the 525,540 rows of both bypass_leakage_075 and bypass_stuck_075, and those two runs agree to within 0.0005 F on the condenser-loop temperatures and exactly on the condenser and tower flows.
- Contradicts: Chiller-plant inventory Tables 3-4 and Granderson et al. 2023 Table 7 (condenser-water three-way valve leakage at 25%, 50% and 75%, imposed by raising the valve's minimum position, and stuck at 50% and 75%, a fixed position: listed as separate, graded fault cases) (LBNL FDD Data Sets, doi:10.25984/1881324; Granderson et al. 2023, Sci Data 10:342, doi:10.1038/s41597-023-02197-w)
- Handling: annotate -- left as published and recorded in the provenance. Left as published and still scored: every bypass run raises chiller lift, so all five remain chiller_efficiency positives. Read the file-name severity as the imposed valve setting, not the leak size; treat bypass_leakage_075 and bypass_stuck_075 as one case counted twice; and read the 100-160 F condenser water as a simulation artefact (a real water-cooled chiller would trip on high head pressure well before it): the direction of each finding is meaningful, its size is not.
lbnl-boiler: LBNL simulated boiler plant (labelled faults, Brick model)
BOI_STA is the boiler enable, not burner firing
- Issue:
boiler-status-is-enable - Columns:
BOI_STA_1,BOI_STA_2 - Evidence: In the fault-free run BOI_STA_1 is 1 in 100% of rows while boiler 1 burns no gas (BOI_GAS_CSUM_1 = 0) in 50.5% of them.
- Contradicts: Boiler-plant inventory Table 2 (BOI_STA: on-off status of a boiler, 0-Off; 1-On) (LBNL FDD Data Sets, doi:10.25984/1881324; Granderson et al. 2023, Sci Data 10:342, doi:10.1038/s41597-023-02197-w)
- Handling: annotate -- left as published and recorded in the provenance. Left unmapped: mapping it to boiler_status would read every enabled-but-idle minute as firing. Since 0.98 the rules that need a run status (boiler_summer_lockout, boiler_short_cycle, hw_plant_deltat) read firing from boiler 1's gas input (gas_input_rate) instead, and say so in a caveat.
HWL_DPSPT is the loop DP setpoint in inH2O, not a temperature setpoint
- Issue:
dp-setpoint-described-as-temperature - Columns:
HWL_DPSPT - Evidence: HWL_DPSPT is the constant 480.52 in every row: 17.36 psi expressed in inH2O, matching Table 1's 17.5 psi loop differential-pressure setpoint and the fault-free HWL_DP median (480.52).
- Contradicts: Boiler-plant inventory Table 2 (HWL_DPSPT: hot water loop supply water temperature setpoint, F) (LBNL FDD Data Sets, doi:10.25984/1881324; Granderson et al. 2023, Sci Data 10:342, doi:10.1038/s41597-023-02197-w)
- Handling: annotate -- left as published and recorded in the provenance. Mapped as hw_diff_press_sp with its unit declared as inH2O (and HWL_DP as hw_diff_press, inH2O, as Table 2 says).
Pump 2's power has negative spikes in the fault-free run
- Issue:
negative-pump-power-spikes - Columns:
PM_POW_2 - Evidence: Fault-free PM_POW_2 reaches -102,400.7 kW (2018-12-15 11:19, pump 2 off); 40 rows are below -1 kW and 13 below -1,000 kW. (The literal 'NAN' pump-power entries in eight runs are documented by the inventory's Table 4 footnote.)
- Contradicts: Boiler-plant inventory Table 2 (PM_POW: power consumption of pump, kW) (LBNL FDD Data Sets, doi:10.25984/1881324; Granderson et al. 2023, Sci Data 10:342, doi:10.1038/s41597-023-02197-w)
- Handling: annotate -- left as published and recorded in the provenance. Left as published; pump power is not mapped to a role in this entry.
hot_water_temp_bias biases the loop return, not the supply
- Issue:
loop-temp-bias-is-on-the-return - Columns:
HWL_RW_TEMP,HWL_SW_TEMP - Evidence: In the four hot_water_temp_bias runs HWL_RW_TEMP moves by -7.2 / -3.6 / +3.6 / +7.2 F (median difference from the fault-free run for -4 / -2 / +2 / +4 C) and HWL_SW_TEMP by 0.0.
- Contradicts: Boiler-plant inventory Tables 3-4 (bias of the hot water leaving temperature sensor of the hot water loop) (LBNL FDD Data Sets, doi:10.25984/1881324; Granderson et al. 2023, Sci Data 10:342, doi:10.1038/s41597-023-02197-w)
- Handling: annotate -- left as published and recorded in the provenance. Scored under the published label; read these runs as a loop return-temperature sensor bias.
The boiler and loop-DP bias faults are hidden in their own sensors
- Issue:
where-the-bias-faults-show - Columns:
BOI_SW_TEMP_1,HWL_SW_TEMP,HWL_DP,PM_SPD_1 - Evidence: The controlled sensors keep reading their setpoints: in the boiler_bias runs BOI_SW_TEMP_1 stays at 176 F while the loop supply HWL_SW_TEMP moves by +7.2 / +3.6 / -3.6 / -7.2 F (-4 / -2 / +2 / +4 C); in the hot_water_pressure_bias runs HWL_DP stays at its setpoint (median difference 0.0) and pump 1's speed moves by +0.034 / +0.016 / -0.013 / -0.025 (-20 / -10 / +10 / +20%).
- Contradicts: Boiler-plant inventory section 3 (for sensor bias faults the logged value of the faulty sensor is the faulty value) (LBNL FDD Data Sets, doi:10.25984/1881324; Granderson et al. 2023, Sci Data 10:342, doi:10.1038/s41597-023-02197-w)
- Handling: annotate -- left as published and recorded in the provenance. Left as published: a rule looking for these faults must read the other column (HWL_SW_TEMP, PM_SPD_1).
bdg2: Building Data Genome 2 (whole-building meters)
One site's chilled water is about 1,000x too large
- Issue:
eagle-chilled-water-1000x - Columns:
Eagle_* (chilledwater) - Evidence: The 87 Eagle chilled-water meters have a median 2016 intensity of 17,417 kWh/ft2/yr (cleaned; 17,913 raw) and a median 1,389x the same building's electricity; the other sites' chilled-water meters have a per-building median of 45.8 kWh/ft2/yr and no site median above 77.5. Divided by 1,000 Eagle's median is 17.4 kWh/ft2/yr, 1.4x its electricity -- the factor a kBTU series converted as mmBTU (the unit Table 4 lists for Eagle's chilled water) would carry.
- Contradicts: Miller et al. 2020, Table 4 (Eagle chilled water in mmBTU) and Usage Notes (unit-conversion mistakes fixed in the raw and cleaned sets) (Miller et al. 2020, Sci Data 7:368, doi:10.1038/s41597-020-00712-x)
- Handling: exclude -- kept out of scoring / analysis. Ingested as published (no rescale: the factor is inferred, not documented). Kept out of the benchmark's EUI rollup, which is electricity-only; the change-point acceptance and residual-autocorrelation metrics are scale-free.
One site's meter timestamps lag its weather by about 4-5 hours
- Issue:
eagle-meters-lag-weather - Columns:
timestamp (Eagle_* meters) - Evidence: Eagle's weekday electricity profile runs ~5 h later than the pooled profile of the other sites (overnight minimum at 07-08 h vs 03 h; daytime plateau 14-19 h vs 10-15 h) while its air temperature peaks at 15 h like every site's, and its chilled water peaks at 20 h (12-17 h elsewhere). Cross-correlated with its own air temperature, Eagle's meters align best when the weather is shifted 5 h (chilled water) / 3 h (electricity) later, against -4 to +1 h at the other sites (where the correlation is meaningful) -- a UTC-like clock on a US/Eastern site.
- Contradicts: Miller et al. 2020, Usage Notes (the BDG2 timestamps, weather included, are in the local time zone) (Miller et al. 2020, Sci Data 7:368, doi:10.1038/s41597-020-00712-x)
- Handling: annotate -- left as published and recorded in the provenance. Left as published: the offset is inferred (4 or 5 h), not documented, so it is not shifted. Daily models are barely affected; an hourly or time-of-week analysis of Eagle should shift its meters.
One site's hot water is about 1,000x too large
- Issue:
eagle-hot-water-1000x - Columns:
Eagle_* (hotwater) - Evidence: 58 of the 60 Eagle hot-water meters carry the chilled-water issue's signature: a median 2016 intensity of 10,797 kWh/ft2/yr (cleaned; 11,771 raw) and a median 867x the same building's electricity (827x over 2016-2017). The hot-water meters at Bobcat, Crow, Moose and Robin run at a per-site median of 0.3-2.1x their electricity. CAMBER's unit-scale check (#71) judges those 58 meters implausible as given, with x0.001 most likely at high confidence; the other two are plausible at low confidence. Divided by 1,000 Eagle's median is 10.8 kWh/ft2/yr, 0.87x its electricity -- the factor a kBTU series converted as mmBTU (the unit Table 4 lists for Eagle's hot water) would carry.
- Contradicts: Miller et al. 2020, Table 4 (Eagle hot water in mmBTU) and Usage Notes (unit-conversion mistakes fixed in the raw and cleaned sets) (Miller et al. 2020, Sci Data 7:368, doi:10.1038/s41597-020-00712-x)
- Handling: annotate -- left as published and recorded in the provenance. Ingested as published (no rescale: the factor is inferred, not documented), as for the site's chilled water. The BDG2 ingest's unit-scale check reports each of the 58 meters as an ingest warning (x0.001 most likely); nothing is corrected. No benchmark reads them: the EUI rollup is electricity-only.
One site's hot water reads thousands of kBtu/ft2 a year
- Issue:
fox-hot-water-scale - Columns:
Fox_* (hotwater) - Evidence: 15 of Fox's 68 hot-water meters read 658-12,832 kWh/ft2/yr in 2016 (cleaned; 2,244-43,785 kBtu/ft2/yr), 53-399x (median 82x) the same building's electricity. CAMBER's unit-scale check (#71) judges them implausible as given (x0.001 most likely) and 38 more uncertain. The floor area does not explain it: Fox's sqft and sqm agree (ratio 10.764), its median building (71,421 ft2) is typical of the other sites, and the same 15 buildings' electricity is an ordinary 8.0-48.0 kWh/ft2/yr (median 23.4) on the same floor area, so an area error could account for a factor of 2-3 at most. The hot-water energy scale is the problem, but no single factor fits: the site's hot-water/electricity ratio runs continuously from under 1 to 399x (median 23.5x over all 68 meters, against 0.3-2.1x at Bobcat, Crow, Moose and Robin), and x0.001 applied to the whole site would put its other meters at a median 0.018x their electricity.
- Contradicts: Miller et al. 2020, Table 4 (Fox hot water in mmBTU, converted to kWh by Table 5) and Usage Notes (unit-conversion mistakes fixed in the raw and cleaned sets) (Miller et al. 2020, Sci Data 7:368, doi:10.1038/s41597-020-00712-x)
- Handling: annotate -- left as published and recorded in the provenance. Ingested as published, not rescaled: the factor is neither documented nor uniform across the site. The BDG2 ingest's unit-scale check reports each flagged meter as an ingest warning. Treat Fox hot-water intensities as unreliable; no benchmark reads them (the EUI rollup is electricity-only).
lbnl-b59: LBNL Building 59: three years of a real office's rooftop units, zone CO2 and underfloor terminals
Timestamps are UTC, which no document states
- Issue:
timestamps-in-utc - Columns:
date (every CSV) - Evidence: Solar radiation at the campus station peaks at 20:00-21:00 (792-817 W/m2, 15-25 June 2019) and is zero from 04:00 to 12:00; the camera occupancy counts peak at 17:00-22:00 on weekdays (25 people at 17:00 vs 0.1 at 11:00); and the RTU files run straight through the US spring-forward hour (71 rows from 01:55 to 03:05 on 2018-03-11, 2019-03-10 and 2020-03-08) with no repeated hour in November. Solar noon in Berkeley is about 20:10 UTC in June, so the stamps are UTC (Pacific time minus 7-8 h).
- Contradicts: README_Dryad_Bldg59.txt and the data description table give no time zone; the data descriptor presents the building's schedules and the Table 2 event dates as local time (Luo et al. 2022, Sci Data 9:156, doi:10.1038/s41597-022-01257-x; data doi:10.7941/D1N33Q)
- Handling: none -- described only. Not a correction of values: the ingest declares source_timezone UTC and local_timezone America/Los_Angeles (CAMBER's timestamp semantics, applied in every mode), so the store holds Berkeley wall-clock time and the occupied-hour schedules line up. The November fall-back hour keeps both readings (averaged); quirk timestamps below are UTC.
RTU outdoor-air flow before 2020-04-10 is imputed, not measured
- Issue:
oa-flow-gap-filled - Columns:
rtu_001_oa_flow_tn,rtu_002_oa_flow_tn,rtu_003_oa_flow_tn,rtu_004_oa_flow_tn - Evidence: Up to 2020-04-10 21:59 UTC the hourly OA flows of the four RTUs correlate 0.998-0.999 pairwise (one pattern scaled four ways, 1,005,495 minute rows per RTU); from 22:00 UTC on they correlate 0.72-0.83, the daily minimum drops from above 2,590 cfm to 1,305-1,730 cfm, and the readings reach the transmitter ceiling of 19,999 cfm, which the earlier values never exceed (maxima 13,093-16,148 cfm).
- Contradicts: Data description table (rtu_oa_fr.csv: available Apr-Dec 2020) versus the file, which has values for all of 2018-2020; README methods (gaps filled by linear interpolation, KNN and matrix factorization) (Luo et al. 2022, Sci Data 9:156, doi:10.1038/s41597-022-01257-x; data doi:10.7941/D1N33Q)
- Handling: fix -- corrected at ingest (skipped by
--no-corrections). Masked (NaN) before 2020-04-10 22:00 UTC in every RTU run, so no OA-flow rule or check judges the imputed years; the OA damper position is kept for the whole period.
RTU04's return-air temperature is a copy of its supply-air temperature from September 2019
- Issue:
rtu4-return-copies-supply - Columns:
rtu_004_ra_temp,rtu_004_sa_temp - Evidence: rtu_004_ra_temp equals rtu_004_sa_temp to the last digit in 0.04% of 2018 minutes, 29.8% of 2019 and 99.1% of 2020; from 2019-09-19 on 98.5% of days are at least 90% identical. The other three RTUs' return and supply agree in 0.13-0.22% of minutes (median difference 4.2-5.2 F).
- Contradicts: Brick model (rtu_004_ra_temp is a Return_Air_Temperature_Sensor of RTU04) and the data description table (Roof Top Unit return air temperature) (Luo et al. 2022, Sci Data 9:156, doi:10.1038/s41597-022-01257-x; data doi:10.7941/D1N33Q)
- Handling: annotate -- left as published and recorded in the provenance. Left in place on purpose: it is a genuine data fault that the sensor-health layer's copied-signal check (camber.sensorhealth.copied_signal_consistency) should find. Economizer and mixing-balance results on RTU04 after 2019-09-19 judge a copy.
Mixed-air temperatures leave the outdoor/return band, mostly in 2018-2019
- Issue:
mixed-air-outside-oa-ra-band - Columns:
rtu_001_ma_temp,rtu_002_ma_temp,rtu_003_ma_temp,rtu_004_ma_temp - Evidence: Hourly mixed-air temperature lies more than 2 F outside [min(OAT, RAT), max(OAT, RAT)] -- which a blend of the two cannot do -- in 10.7% (Jul-Dec 2018), 23.0% (Jul-Dec 2019) and 0.6% (Jul-Dec 2020) of RTU01 hours and 4.2%, 9.2% and 13.5% of RTU04 hours (RTU04's return is a copy of supply from 2019-09, see above); RTU02 and RTU03 stay at or below 3.6%.
- Contradicts: Data description table (rtu_*_ma_temp: Roof Top Unit mixed air temperature; the only outlier criterion is < 32 F or > 122 F) (Luo et al. 2022, Sci Data 9:156, doi:10.1038/s41597-022-01257-x; data doi:10.7941/D1N33Q)
- Handling: annotate -- left as published and recorded in the provenance. Left in place: an inaccurate mixed-air sensor is a real sensor-health test (camber.sensorhealth.mixing_consistency; issue #16 would weigh the flow balance into the trust score). Rules that read MAT on RTU01/RTU04 in 2018-2019 are judging a doubtful sensor.
Measured OA flow sits at a 19,999 cfm ceiling and above the unit's own supply flow
- Issue:
oa-flow-exceeds-supply - Columns:
rtu_001_oa_flow_tn,rtu_002_oa_flow_tn,rtu_003_oa_flow_tn,rtu_004_oa_flow_tn,rtu_001_fltrd_sa_flow_tn,rtu_002_fltrd_sa_flow_tn,rtu_003_fltrd_sa_flow_tn,rtu_004_fltrd_sa_flow_tn - Evidence: After 2020-04-10 the OA flow reads exactly 19,999 cfm in 5.55% of RTU04 minutes and 1.24% of RTU01 minutes, and exceeds the same unit's filtered supply airflow in 7.3% (RTU04), 4.1% (RTU01), 1.5% (RTU03) and 1.3% (RTU02) of hours. The descriptor gives each RTU a design supply airflow of 20,000 cfm and a minimum OA of 5,000 cfm.
- Contradicts: Data descriptor, HVAC system description (design airflow 20,000 cfm per RTU, minimum outdoor air 5,000 cfm) (Luo et al. 2022, Sci Data 9:156, doi:10.1038/s41597-022-01257-x; data doi:10.7941/D1N33Q)
- Handling: annotate -- left as published and recorded in the provenance. Left in place: the ceiling is the transmitter span, and OA above supply is a flow-station error the DCV rule's floor check is not affected by (it looks at low flows). Treat OA flow above the supply flow as unmeasured.
One zone CO2 sensor reads far below outdoor air, and every sensor carries a 72 ppm floor
- Issue:
zone-co2-below-outdoor - Columns:
zone_022_co2,zone_028_co2,zone_033_co2,zone_040_co2,zone_044_co2,zone_045_co2,zone_052_co2,zone_058_co2,zone_062_co2,zone_068_co2,zone_072_co2 - Evidence: zone_022_co2 is below 350 ppm in 27,120 minutes (8,420 of them in June 2020, when its monthly median is 362 ppm against 409-420 ppm for the other ten zones) and reads exactly 72 ppm in 11,661 minutes; the other ten sensors touch that same 72 ppm value 1-5 times each. Outdoor CO2 was about 410 ppm.
- Contradicts: Data description table (zone_*_co2: CO2 concentration; the only outlier criterion is < 0) (Luo et al. 2022, Sci Data 9:156, doi:10.1038/s41597-022-01257-x; data doi:10.7941/D1N33Q)
- Handling: annotate -- left as published and recorded in the provenance. Left in place: dcv_system_verification drops CO2 outside 250-5,000 ppm and excludes a zone whose CO2 stays implausible, and sensor health's zone-vs-outdoor CO2 check flags it.
Fan-speed feedback reads -25% while the fans are stopped
- Issue:
fan-speed-negative-when-off - Columns:
rtu_001_sf_vfd_spd_fbk_tn,rtu_002_sf_vfd_spd_fbk_tn,rtu_003_sf_vfd_spd_fbk_tn,rtu_004_sf_vfd_spd_fbk_tn - Evidence: Each supply- and return-fan speed feedback reads -24.9% or -25.0% in 0.9% of minutes (12,419 minutes for RTU01's supply fan, in 13 episodes, e.g. 2018-01-29 and 2019-02-26); in those minutes the unit's filtered supply airflow has a median of 0 cfm.
- Contradicts: Data description table (rtu_*_sf_vfd_spd_fbk_tn: supply fan speed in %) (Luo et al. 2022, Sci Data 9:156, doi:10.1038/s41597-022-01257-x; data doi:10.7941/D1N33Q)
- Handling: annotate -- left as published and recorded in the provenance. Left in place: it reads as fan off (supply flow 0). Sensor health's range check counts the negative values; no template rule gates on the fan speed.
The Brick model and the descriptor's Table 1 assign the zones to different RTUs
- Issue:
brick-and-table-1-disagree-on-rtu-zones - Columns:
zone_*_co2,zone_*_temp - Evidence: For all 11 CO2 zones the serving RTU differs between the Brick model (zone hasLocation RTU0N_Zone) and Table 1 (e.g. zone 22: RTU01 vs RTU4; zone 40: RTU04 vs RTU1; zone 52: RTU02 vs RTU4); over all 51 terminal zones Brick gives 11/10/18/12 zones to RTU01-04 and Table 1 gives 14/23/8/12. Table 4 of the same paper labels RTU 3-4 as North (consistent with Brick) while Table 1 puts RTU 1-2 in the North wing. A physical check is inconclusive: hourly zone-temperature changes correlate best with the Table 1 RTU's supply-temperature changes in 6 of 11 zones and with the Brick RTU's in 5 (all correlations 0.2 or less; the underfloor plenum mixes the units' air).
- Contradicts: Data descriptor Table 1 (RTU service zones) and Table 4 (electrical panels) versus the Brick model Bldg59_w_occ Brick model.ttl (Luo et al. 2022, Sci Data 9:156, doi:10.1038/s41597-022-01257-x; data doi:10.7941/D1N33Q)
- Handling: annotate -- left as published and recorded in the provenance. CAMBER follows the Brick model (the machine-readable metadata shipped with the data) and encodes it in the equipment names (RTU01_zone_022); the naming grouping is heuristic, so fleet DCV severities are capped at warn.
Brick point names do not match the CSV column names for key RTU points
- Issue:
brick-point-names-differ-from-csv - Columns:
rtu_*_oa_flow_tn,rtu_*_oadmpr_pct,rtu_*_fltrd_gnd_lvl_plenum_press_tn,rtu_002_econ_stpt_tn - Evidence: 15 of the Brick model's points name no CSV column (rtu_00N_oa_fr for rtu_00N_oa_flow_tn, rtu_00N_oa_damper for rtu_00N_oadmpr_pct, rtu_00N_fltrd_gnd_plenum_press_tn for rtu_00N_fltrd_gnd_lvl_plenum_press_tn, rtu_021_econ_stpt_tn for RTU02's economizer setpoint, occ_forth_south, lig_S_+), and 77 of the 336 CSV columns have no Brick point (the 44 reheat valves, the SAT setpoints, supply airflows and OA temperatures of all four RTUs, among others).
- Contradicts: README_Dryad_Bldg59.txt (the Brick model represents the metadata of the equipment and sensors) and the data descriptor, Methods: metadata model (Luo et al. 2022, Sci Data 9:156, doi:10.1038/s41597-022-01257-x; data doi:10.7941/D1N33Q)
- Handling: annotate -- left as published and recorded in the provenance. The catalog's mappings name the CSV columns directly (b59_rtu.json, b59_zone.json, b59_uft.json) and take only the zone -> RTU chain from the Brick model; a Brick-driven mapping needs these renames as overrides.
The data description table miscounts some files and gives the static pressure in psi
- Issue:
description-table-counts - Columns:
zone_*_co2,zone_*_fan_spd,zone_*_hw_valve,rtu_*_pa_static_stpt_tn - Evidence: zone_co2.csv has 11 CO2 columns (the table says 13; the Brick model also has 11 CO2 sensors); uft_fan_spd.csv has 51 columns and uft_hw_valve.csv 44 (the table says 44 and 51); the plenum static setpoint reads 0.06 (RTU03 also 0.6) -- an underfloor-plenum setpoint in inH2O, not the 'psi' the table states (0.06 psi would be 1.7 inH2O).
- Contradicts: data_description_table_3year_clean_data.xlsx (Number of data points, Unit) (Luo et al. 2022, Sci Data 9:156, doi:10.1038/s41597-022-01257-x; data doi:10.7941/D1N33Q)
- Handling: none -- described only. Nothing to correct in the values: the catalog maps the 11 CO2 columns that exist, and does not map the plenum static setpoint.
From 2020, ele.csv carries six meters under five column names, shifted one place right
- Issue:
ele-2020-columns-shifted - Columns:
mels_N,hvac_N,hvac_S - Evidence: The header is date,mels_S,lig_S,mels_N,hvac_N,hvac_S plus a trailing empty name. Through 2020-01-01 00:00 UTC the sixth value is empty; from 00:15 UTC every 2020 row (35,136 rows) fills it. At that boundary mels_N's 8.20 kW reappears under hvac_N (8.21), hvac_N's 23.71 kW under hvac_S (24.02) and hvac_S's 28.02 kW in the unnamed sixth column (25.88); the hourly weekly profile of January 2020 'hvac_N' correlates 0.95 with December 2019 mels_N at the same level (12.0 vs 12.2 kW). The 2020 'mels_N' slot holds an unidentified meter (about 20 MWh a year, never zero at night). Read by the header, 2020 sums to 342.9 MWh; remapped by position, 509.4 MWh.
- Contradicts: Data description table (ele.csv: five meters mels_S, lig_S, mels_N, hvac_N, hvac_S; its cleaning notes cover ele.csv only to 2020-01-01) and the ele.csv header (Luo et al. 2022, Sci Data 9:156, doi:10.1038/s41597-022-01257-x; data doi:10.7941/D1N33Q)
- Handling: fix -- corrected at ingest (skipped by
--no-corrections). Remapped by position at ingest (remap quirk on the ele_* runs, from 2020-01-01 00:15 UTC): file mels_N -> unlabelled_meter (stored as ELE_unlabelled_meter, empty before 2020), file hvac_N -> mels_N, file hvac_S -> hvac_N, the unnamed sixth column -> hvac_S. Corrected, mels_N runs on across the boundary (8.3 -> 8.2 kW at local midnight) instead of dropping to 1.9 kW. The whole-building series is the sum of the stored meters, and it has six from 2020 against five before: a boundary change of about 20 MWh a year that an M&V comparison across 2019-2020 has to treat as non-routine. --no-corrections ingests the header as published (and no unlabelled meter).
The HVAC panel meters read exactly 0 kW while the rooftop units run
- Issue:
ele-hvac-zero-dropouts - Columns:
hvac_N,hvac_S - Evidence: hvac_S reads exactly 0 in 3,191 (2018), 8,912 (2019) and 4,378 (2020) of its 15-minute intervals (UTC years; the 2020 values are the shifted sixth column), and hvac_N in 4,113 intervals of 2019; about 98% of those hvac_S zeros fall while an RTU 1-2 supply fan runs above 20%, which a panel feeding two running fans cannot read. Runs reach 23-28 h (for example 2019-05-25 and 2019-09-29) and cluster in February-May and October-November 2019. Filling them with the same clock time's median within 7 days adds 16.6 MWh to 2018 and 45.4 MWh to 2019 over complete days.
- Contradicts: README_Dryad_Bldg59.txt (gaps filled by linear interpolation, K-nearest neighbors and matrix factorization); data description table (the only electricity outlier criterion is < 0) (Luo et al. 2022, Sci Data 9:156, doi:10.1038/s41597-022-01257-x; data doi:10.7941/D1N33Q)
- Handling: fix -- corrected at ingest (skipped by
--no-corrections). Masked and filled at ingest on ele_hvac_N / ele_hvac_S (after the 2020 remap): every exact 0 kW reading is masked (a mask quirk; about 2% of the zeros fall while neither of the panel's RTU supply fans is above 20%, and they are masked too), then every missing run of up to 48 h is filled with the median of the same UTC clock time over the 7 days either side (a fill quirk); longer gaps stay missing, so those days still fail completeness. The fill adds about 2 MWh (hvac_N) and 15 MWh (hvac_S) to 2018 and 20 / 29 MWh to 2019, and reproduces a hand correction masked only on fan-running intervals and filled in local clock time to within 0.4% of the HVAC energy on the 1,026 complete days. --no-corrections keeps the zeros.
The replaced air-source heat pump was metered on hvac_N; its water-source replacement is on no ele.csv meter
- Issue:
heat-pump-swap-leaves-the-meter - Columns:
hvac_N,hvac_S - Evidence: While the old heat pump runs (hot-water supply 85-105 F in hp_hws_temp) hvac_N carries an extra 15.4 kW (hourly regression 2018-11-27 to 2019-03-31, se 0.26 kW; hvac_S -0.3 kW); hvac_N falls from 33-42 to 20-25 kW on each trial of the new unit (2018-12-17/18 and 2019-01-09 to 01-11, water at 120 F), returns with the old unit (2019-01-14 to 02-05) and stays at 9-20 kW after the switch on 2019-02-06. In August-December 2020 HVAC power does not rise with the new unit's metered heat (-0.07 kW per kW of heat, se 0.011). On the 302 calendar days complete in both years, 2018 to 2019 HVAC energy falls 44% while plug loads and lighting are flat or up; hvac_S also steps down about 10 kW inside the 2018-11-16 to 11-27 data gap, undocumented.
- Contradicts: Data descriptor: the heat pump is 'air-source type before March 2019, later replaced with water-source', and the EUI of 2018 is higher than 2019 and 2020 'due to the building retrofit' (Luo et al. 2022, Sci Data 9:156, doi:10.1038/s41597-022-01257-x; data doi:10.7941/D1N33Q)
- Handling: annotate -- left as published and recorded in the provenance. Left in place (annotate quirk on ele_hvac_N and hp): the meter readings are right; the metering boundary changed. A weather-normalised comparison across 2019-02-06 needs a non-routine adjustment (about 15.4 kW on hvac_N while the old unit runs) or a baseline that starts after the switch. The ingest stores the heat pump's hot-water supply temperature as equipment HP (hw_supply_temp), which identifies the old unit's hours (85-105 F, the new unit holds about 120 F), so the adjustment can be computed from the store.
valladolid-uva: Valladolid university buildings: hourly whole-building electricity, 2016-2020
Local-time stamps label the end of each hour, and the DST handling changes between years
- Issue:
hour-ending-local-clock - Columns:
DATE - Evidence: The spring-forward days lack the 03:00 label, not 02:00 (A: 2016-03-27, 2018-03-25, 2019-03-31, 2020-03-29; B: the same except 2020), and the fall-back days repeat 03:00 (A: 2016-10-30, 2018-10-28, 2019-10-27, 2020-10-25; B: 2016, 2018, 2019): an hour-ending label on Spanish local time, where the skipped and repeated interval is 02:00-03:00. 2017 has neither a gap nor a repeat in either file (24 rows on 2017-03-26 and 2017-10-29), nor does B in 2020. The first stamp, 2016-01-01 00:00, has no energy in A (the interval before the file starts).
- Contradicts: The dataset description gives '1-hour intervals' and no time zone or interval convention (Mendeley Data description, doi:10.17632/mzkyh37mtr.2)
- Handling: annotate -- left as published and recorded in the provenance. Stored as published (1 h, local, no time zone conversion). The duplicated fall-back labels keep their first reading (ingest drops duplicated stamps), so one hour a year is lost in the affected years. Analyses that form days move each reading to the start of its hour first; the chaining example does.
The files run to the end of 2020; the description says 2016-2019
- Issue:
data-extend-to-2020 - Columns:
DATE,ENERGY - Evidence: Both files hold 43,848 rows from 2016-01-01 00:00 to 2020-12-31 23:00 (8,716-8,780 energy readings a year). 2020 is a COVID-19 year: Building A used 1,344 MWh (1,443-1,491 MWh in 2016-2019) and Building B 390 MWh (554-701 MWh), with the monthly mean load in April and May 2020 at 54% and 62% (A) and 38% and 30% (B) of the same months in 2019.
- Contradicts: 'These datasets contain historical energy consumption data for two buildings from 2016 to 2019' (Mendeley Data description, doi:10.17632/mzkyh37mtr.2)
- Handling: exclude -- kept out of scoring / analysis. Ingested in full. 2020 is kept out of baseline and reporting in the chaining example: the COVID-19 closure (Spain's state of alarm from 14 March 2020) is a non-routine period, and the HOLIDAY flag changes convention in 2020 (see holiday-flag-is-an-academic-calendar).
The weather columns are daily values repeated on every hour
- Issue:
weather-is-daily - Columns:
T2M,T2M_MIN,T2M_MAX,RH2M,PRECTOT,ALLSKY,HDD18_3,CDD0,CDD10 - Runs:
weather - Evidence: Every weather column has exactly one value per calendar day in both files (1,827 days); T2M ranges -2.62 to 28.63 C. The daily mean of the nearest ISD station (VALLADOLID, 4.6 km) correlates 0.99 with T2M and runs 1.3 F warmer on average (2016-2020).
- Contradicts: 'The data is provided in 1-hour intervals. It also has other variables such as weather variables' (Mendeley Data description, doi:10.17632/mzkyh37mtr.2)
- Handling: annotate -- left as published and recorded in the provenance. T2M is stored as 'oat' on the equipment 'weather' (degC -> F) and fits daily or monthly models; it is not an hourly temperature. Hour-of-day analyses need a station series (camber.weather_source.oat_reference_auto).
ALLSKY and PRECTOT do not carry the units or quantity the description gives
- Issue:
weather-units-mislabelled - Columns:
ALLSKY,PRECTOT - Evidence: ALLSKY ranges 0.27-8.67 (median 4.45): the range of NASA POWER's all-sky surface shortwave irradiance in kWh/m2/day, not a longwave downward irradiance in W/m2 (roughly 200-400 W/m2 at this site). PRECTOT reaches 46.17 on one day with a median of 0.08 and is constant over each day: a daily total in mm/day, not mm/hour.
- Contradicts: 'ALLSKY - All-Sky Surface Longwave Downward Irradiance (W/m^2)'; 'PRECTOT - Precipitation (mm/hour)' (Mendeley Data description, doi:10.17632/mzkyh37mtr.2)
- Handling: none -- described only. Neither column is mapped.
HOLIDAY marks weekends and the academic breaks, and changes convention in 2020
- Issue:
holiday-flag-is-an-academic-calendar - Columns:
HOLIDAY - Evidence: In 2016-2019 HOLIDAY is 1 on 173-186 days a year: every weekend, all of July and August, the Christmas and Easter breaks and the public holidays (2017: 177 days). In 2020 it is 1 on 15 days in A's file and on some or all hours of 22 days in B's (14 of them only partly, April-October), so the two files' 2020 calendars differ; weekends and the summer break are no longer flagged.
- Contradicts: 'HOLIDAY - Holidays in Spain' (Mendeley Data description, doi:10.17632/mzkyh37mtr.2)
- Handling: none -- described only. Not mapped. The chaining example uses it, 2016-2019 only, as the working-day calendar (Monday-Friday with HOLIDAY 0 on most of the day's hours).
Missing hours are left empty, not interpolated
- Issue:
missing-hours-not-interpolated - Columns:
ENERGY - Evidence: A has 102 empty ENERGY hours (15 / 4 / 12 / 3 / 68 in 2016-2020; longest runs 23 h from 2020-05-23 00:00 and 17 h from 2020-05-08 17:00), B 67 (longest 23 h from 2020-05-23 00:00). No reading is zero or negative, and no value repeats more than twice in a row.
- Contradicts: The buildings' paper: missing values (under 0.3%) were filled by linear interpolation (Mariano-Hernandez et al. 2022, Energy Sci Eng 10:4694-4707, doi:10.1002/ese3.1298)
- Handling: none -- described only. Nothing to correct: the gaps are real missing readings. Daily analyses use whole days only (at least 23 readings and none missing).
The files are A and B; the documentation names Building 1 and Building 2
- Issue:
building-labels - Columns:
db_building_A.csv,db_building_B.csv - Evidence: The Mendeley record does not say which file is which building. A's annual energy is flat (1,491 / 1,442 / 1,484 / 1,483 MWh in 2016-2019) and B's falls every year (701 / 660 / 612 / 554 MWh), as the paper describes Building 1 (similar consumption across the years) and Building 2 (retrofits and renewables reducing annual consumption); B's summer-weekend midday load sits below its night load, by 6.5 kWh in 2016 and 20.4 kWh in 2019, the signature of on-site solar.
- Contradicts: Table 2 and section 2.1 of the buildings' paper name Building 1 and Building 2 (Mariano-Hernandez et al. 2022, Energy Sci Eng 10:4694-4707, doi:10.1002/ese3.1298)
- Handling: none -- described only. The catalog keeps the file names (UVA_A, UVA_B) and reads A as Building 1, B as Building 2, stating it as an inference.
Building B's meter is net of on-site generation added during the record
- Issue:
building-b-net-of-onsite-generation - Columns:
ENERGY (db_building_B.csv) - Runs:
building_b - Evidence: On summer weekends (May-August) B's 12:00-15:59 load is below its 02:00-05:59 load by 6.5 / 9.4 / 15.1 / 20.4 kWh in 2016 / 2017 / 2018 / 2019 (A: +1.7 to +7.2 kWh); B's lowest readings (5.6-6.7 kWh) all fall around midday. The paper documents the incorporation of renewable energy but gives no dates or capacity.
- Contradicts: The dataset description calls ENERGY the energy consumption of the building; the paper describes the renewable generation (Mariano-Hernandez et al. 2022, Energy Sci Eng 10:4694-4707, doi:10.1002/ese3.1298)
- Handling: annotate -- left as published and recorded in the provenance. Left as published. A saving measured on B's meter includes the on-site generation behind it, not only the efficiency measures; the VALIDATION chaining case says so.
finnish-dcv: Finnish laboratory office room with occupancy-based DCV (ground-truth counts)
The test's DCV law runs at 4 l/s + 6 l/s per person, not the documented 3 l/s base
- Issue:
dcv-base-flow-is-4-not-3 - Columns:
Supply airflow (l/s),Occupant count (ML estimate) - Evidence: In ventilation_test.csv the median supply airflow is 4.04, 10.06, 15.93 and 22.01 l/s at 0, 1, 2 and 3 estimated occupants -- 4 + 6n -- and the median residual against 3 + 6n is +1.02 l/s over the 1,430 minutes (median absolute residual 1.09 l/s; 76% of minutes within 1.5 l/s once the 5-minute update lag is allowed for). A +1 l/s offset at 4 l/s is 25%, beyond the flow sensor's stated +/-5%.
- Contradicts: Zenodo record description, 'Occupancy-based control': base ventilation 3 l/s (unoccupied), 6 l/s per detected occupant, updated every 5 minutes (Mikala, Xu, Huotari 2026, Zenodo doi:10.5281/zenodo.18299691)
- Handling: none -- described only. Nothing is changed: CAMBER's DCV rule does not assume a control law, it tests whether outdoor air rises with demand. The template's area floor (Ra x Az) sits below both 3 and 4 l/s.
Supply airflow reads negative near zero flow and spikes above 100 l/s
- Issue:
airflow-negative-and-spikes - Columns:
Supply airflow (l/s),Extract airflow (l/s) - Evidence: The supply airflow is negative in 52, 47 and 14 minutes of the three files (minimum -6.40 l/s in training 1), and above 100 l/s in 63 minutes of training 1 (maximum 362.4 l/s on 2024-09-06, 2024-09-19 and 2025-03-25) -- about 59 air changes per hour in the 22 m3 room, against a test-period maximum of 64.9 l/s.
- Contradicts: Zenodo record description (Lindab FTCU airflow, +/-5%; supply and exhaust flows held equal) (Mikala, Xu, Huotari 2026, Zenodo doi:10.5281/zenodo.18299691)
- Handling: annotate -- left as published and recorded in the provenance. Left in place: the small negatives are the transmitter's zero offset with the supply stopped, which the DCV rule reads as no ventilation; the spikes are single minutes that the 5-minute resample averages down.
One relative-humidity reading of 666%
- Issue:
humidity-over-100 - Columns:
Relative Humidity (%) - Evidence: training_data_1.csv reads 665.99% at 2024-09-16 09:53; every other reading of the three files is at most 52.5% except this one (training 1 median 37.9%).
- Contradicts: Zenodo record description (Miran DLS relative humidity, +/-2.5%) (Mikala, Xu, Huotari 2026, Zenodo doi:10.5281/zenodo.18299691)
- Handling: annotate -- left as published and recorded in the provenance. Not mapped (CAMBER has no room-humidity role), so it never reaches a rule; recorded for learners reading the raw file.
b4b-windesheim: Brains4Buildings Windesheim office rooms: two CO2 sensors, ventilation valve and occupancy
Room 925038's valve fraction is an assumed constant, not a measurement
- Issue:
valve-assumed-constant - Columns:
bms_valve_frac__0 (room 925038) - Evidence: bms_valve_frac__0 is exactly 1.00 in all 2,683 of room 925038's intervals (one unique value), while the other two rooms' valves sit at the 0.20 minimum in 79-81% of intervals and reach 0.99.
- Contradicts: README, footnote 1 to the properties table: valve fractions of this building could not be exported and 1.00 was assumed because ventilation was intended to run at maximum; the file presents it as the BMS-measured property valve_frac__0 (Brains4Buildings2022 dataset README, https://github.com/energietransitie/b4b-windesheim-brains4buildings2022-dataset/blob/188573d39ca9a775f8ef17a10ccac784d84b7be7/README.md)
- Handling: exclude -- kept out of scoring / analysis. Room 925038 is ingested without its valve (mapping b4b_bms_novalve.json), so no DCV verdict is drawn from an assumed constant; its CO2, temperature and occupancy remain for inspection.
CO2 values are baseline-shifted by the publisher, and one room's minimum is not the stated 416 ppm
- Issue:
co2-baseline-shifted - Columns:
bms_co2__ppm,CO2-meter-SCD4x_co2__ppm - Evidence: The documented shift raises each sensor's minimum to 416 ppm, but the preprocessed minima are 455.0 ppm (room 917810, BMS), 416.1 and 426.7 ppm (the other BMS sensors) and 421-436 ppm (SCD41). In the same room the two sensors differ by a median of +7.8 ppm (917810) and -39 ppm (925038, 999169), correlating 0.80-0.91.
- Contradicts: README, Preprocessed data: per room and source the minimum CO2 value is raised to 415 ppm plus a 1 ppm margin (Brains4Buildings2022 dataset README, https://github.com/energietransitie/b4b-windesheim-brains4buildings2022-dataset/blob/188573d39ca9a775f8ef17a10ccac784d84b7be7/README.md)
- Handling: annotate -- left as published and recorded in the provenance. Left as published: the DCV rule reads CO2 changes (lift within the hour of day), which a constant shift does not move; absolute thresholds (co2_ventilation) read shifted values.
nuig-ahu101: NUIG lecture-theatre AHU101 (real BMS trends, unlabelled)
Timestamps are the local (Irish) wall clock, labelled +00:00
- Issue:
local-clock-labelled-utc - Columns:
timestamp (every point file) - Evidence: All 559,857 stamps of the supply-temperature file (and of every other point) end in +00:00. Yet the only 1-hour hole in the AHU points before the summer outages is exactly 2018-03-25 01:00-01:59, the hour Irish clocks skip at the spring change: a true-UTC log has that hour (it is 02:00-02:59 local). The autumn change's repeated hour (2018-10-28 01:00-01:59) appears once, 60 rows, as a local clock that drops the repeat records it.
- Contradicts: the point files' ISO-8601 stamps (offset +00:00); the record states no other time zone (Messervey et al. 2019, Zenodo, doi:10.5281/zenodo.3406555)
- Handling: annotate -- left as published and recorded in the provenance. CAMBER keeps the wall-clock values as written and drops the +00:00 label (no conversion), so schedule rules see Irish local hours. The one missing spring hour stays missing; the repeated autumn hour cannot be recovered.
Room CO2 is clipped at the sensors' 2000 ppm full scale
- Issue:
co2-clipped-at-full-scale - Columns:
NUIG_AHU101_Ctrls_Lecture_Theatre_3_Avg_CO2_D26_481,NUIG_AHU101_Ctrls_CO_147_1_Lecture_Theatre_3_CO2_D10_462,NUIG_AHU101_Ctrls_CO_147_2_Lecture_Theatre_3_CO2_D7_466 - Evidence: The room-average CO2 reads exactly 1999.9985 ppm, its maximum, in 8,212 of 416,950 minutes (1.97%, 137 h); the next-highest value is 1998.99. Every one of those minutes has the supply fan at 0% (4 of 142,141 fan-on minutes reach it). The two room sensors clip identically (8,933 and 8,769 minutes, 99.9% fan off).
- Contradicts: Variables workbook (NUIG_variables_MR1_MP5_AHU101 focus v1.xlsx): CO2 in ppm with the Min / Max range columns blank, so the 2000 ppm ceiling is not documented (Messervey et al. 2019, Zenodo, doi:10.5281/zenodo.3406555)
- Handling: annotate -- left as published and recorded in the provenance. Left as published. A clipped reading is a lower bound (the true CO2 was at least 2000 ppm); CAMBER's ventilation rules treat a reading at full scale with the fan off as not judged rather than as a measured value.
Several points cover much less than January 2018 - February 2019
- Issue:
coverage-shorter-than-described - Columns:
NUIG_AspectGroup_Weather_Current_Temperature_8841,NUIG_AspectGroup_Weather_Current_Humidity_8840,NUIG_AHU101_Ctrls_Lecture_Theatre_3_Avg_CO2_D26_481,NUIG_AHU101_Ctrls_117_Lecture_Theatre_3_Av__Humidity_D28_482,NUIG_EnC_West_Rads_Energy_D14_134,timestamp (every point file) - Evidence: The weather-station points run 2018-04-17 to 2019-02-05 (316,736 minutes, 25% of their span missing, including a 39-day hole from 2019-01-23); the room CO2 / humidity averages start 2018-04-10; the heating meter starts 2018-05-24, not April. Every point shares four outages of 13.1, 12.2, 4.7 and 4.7 days (2018-05-29, 07-16, 08-21, 11-14): the AHU points miss 8.3% of their 610,560 minutes.
- Contradicts: Record description: AHU, room and outdoor data 'available for the period from January 2018 to the end of February 2019, at the measuring time interval of 1 minute'; the heating meter 'from April 2018' (Messervey et al. 2019, Zenodo, doi:10.5281/zenodo.3406555)
- Handling: annotate -- left as published and recorded in the provenance. Left as published; the gaps stay gaps. Outdoor-air-dependent analyses see no weather before 2018-04-17 or after 2019-02-05.
TE_102_2 ('air after cooling coil') does not track AHU101
- Issue:
second-cooling-coil-sensor-not-ahu101 - Columns:
NUIG_AHU101_Ctrls_TE_102_2_Cooling_Off_Coil_Temp_D6_459 - Evidence: With the supply fan running, TE_101_3 (the other 'air after cooling coil' point) correlates 0.92 with the supply-duct temperature while TE_102_2 correlates 0.31, and TE_102_2 has the same median with the fan on and off (20.63 vs 20.64 C) where TE_101_3 moves 19.0 vs 15.9 C. Its tag names unit 102.
- Contradicts: Variables workbook: both TE_101_3 and TE_102_2 described as 'AHU101 air temperature after cooling coil' (Messervey et al. 2019, Zenodo, doi:10.5281/zenodo.3406555)
- Handling: none -- described only. TE_102_2 is not mapped. Since 0.93 TE_101_3, the cooling-coil leaving temperature that does track AHU101, is mapped as cool_coil_leaving_temp; the supply-duct sensor stays the supply air temperature.
One listed point file is empty
- Issue:
riser-valve-point-empty - Columns:
NUIG_AHU101_Ctrls_LPHW_2_GFC4_Riser_3_IFM_D21_467 - Evidence: The archive member is 0 bytes (0 rows) while the other 35 point files hold 316,736-559,857 rows each.
- Contradicts: Variables workbook: 'AHU101 percentage opening of valve of GFC4 riser', sampled every 60 s (Messervey et al. 2019, Zenodo, doi:10.5281/zenodo.3406555)
- Handling: none -- described only. Not mapped; described only.
irish-ahu: Irish industrial AHU (real BMS trends, unlabelled)
Sentinel readings in the supply and outdoor temperatures
- Issue:
sentinel-temperatures - Columns:
DaTemp,OaTemp - Evidence: DaTemp reads 938.5-1000 C in 26 rows (17 of them exactly 1000.0), all on 2021-03-02 10:00-16:15; OaTemp reads 609.98 C in 3 rows on 2022-10-08 08:45-09:15. The next-highest values are 46.66 C (supply, p99.9) and 36.91 C (outdoor).
- Contradicts: Data descriptor, data table: DaTemp 'Supply air temperature' and OaTemp 'Outside air temperature sensor', both in C (Ahern, O'Sullivan & Bruton 2023, Data in Brief 48:109208, doi:10.1016/j.dib.2023.109208)
- Handling: fix -- corrected at ingest (skipped by
--no-corrections). Readings above 60 C are blanked in both columns (mask quirk); --no-corrections keeps them.
BMS outages are logged as 0.00 C, not as gaps
- Issue:
outages-logged-as-zero - Columns:
RaTemp,MaTemp,DaTemp,OaTemp,HCALTemp,CCALTemp,ZoneTemp_1 - Evidence: RaTemp and DaTemp both read exactly 0.00 in 3,230 rows on 57 days (2017-07-06 to 2022-10-31), mostly whole days of 96 rows; in 94% of them MaTemp, HCALTemp, CCALTemp and ZoneTemp_1 are 0.00 too. A further 58 MaTemp zeros coincide with an outdoor reading of 0.00 or a missing return reading. OaTemp reads 0.00 in 168 rows while the nearby weather station reads a median 12.7 C.
- Contradicts: Data descriptor: missing BMS data were backfilled from cloud storage, and missing intervals are left as missing time intervals (Ahern, O'Sullivan & Bruton 2023, Data in Brief 48:109208, doi:10.1016/j.dib.2023.109208)
- Handling: fix -- corrected at ingest (skipped by
--no-corrections). Exact 0.00 readings of the mapped return, mixed, supply and outdoor temperatures are blanked (mask quirk). A genuine 0.00 C outdoor or mixed-air reading would be lost too; the evidence above says there are none worth keeping.
The damper signals read 0% for six weeks of the COVID-19 100% outdoor-air period
- Issue:
damper-signal-zero-during-100pct-oa - Columns:
OaDmprPos,RaDmprPos,EaDmprPos - Evidence: All three damper signals read 0 in 4,592 rows from 2020-12-15 03:30 to 2021-01-31 23:45, bracketed by weeks at OA 100% / return 0%. In those rows MaTemp - OaTemp is a median 0.23 C and RaTemp - MaTemp 13.55 C: the mixed air is outdoor air, as in the 100%-outdoor-air months Mar-Nov 2021 (0.11 / 8.01 C) and unlike the 20% minimum-OA months Sep 2019 - May 2020 (9.30 / 1.02 C).
- Contradicts: Data descriptor: the outside-air damper was fixed at 100% open as a COVID-19 precaution until the control review of 2021-12-02 (Ahern, O'Sullivan & Bruton 2023, Data in Brief 48:109208, doi:10.1016/j.dib.2023.109208)
- Handling: fix -- corrected at ingest (skipped by
--no-corrections). OaDmprPos zeros between 2020-12-15 and 2021-02-01 are blanked (mask quirk), not replaced with 100%; the return and exhaust damper signals are not mapped.
The unit's outdoor sensor reads warmer than the weather station
- Issue:
outdoor-sensor-reads-warm - Columns:
OaTemp,OaTemp_WS - Evidence: Over the 85,409 rows with both (2020-06 on, sentinels and zeros excluded) OaTemp - OaTemp_WS is a median +1.25 C (p10 -0.59, p90 +3.64), 0.8 C at night rising to 2.2 C at 15 h; quarterly medians are -0.40 / -0.24 C in 2020 Q2-Q3, then +0.95 to +1.65 C from 2020 Q4.
- Contradicts: Data descriptor, data table: OaTemp 'Outside air temperature sensor' and OaTemp_WS 'Outside air temperature from nearby weather station' (Ahern, O'Sullivan & Bruton 2023, Data in Brief 48:109208, doi:10.1016/j.dib.2023.109208)
- Handling: annotate -- left as published and recorded in the provenance. Left as published. OaTemp stays the OA temperature: it is the air entering this unit and the only outdoor reading before 2020-06. The afternoon excess suggests solar or intake heating; the step after 2020 Q3 is not explained.
Zone 1 temperature carries a +489 / -509 offset for 2.5 years
- Issue:
zone-1-temperature-offset - Columns:
ZoneTemp_1,ZoneTemp_2 - Evidence: ZoneTemp_1 reads a median 510.49 in 53,869 rows (2017-11-16 to 2019-07-01) and -488.87 in 26,776 rows (2019-07-15 to 2020-06-24); elsewhere its median is 21.07. ZoneTemp_2 reads 84.65 in 397 rows.
- Contradicts: Data descriptor, data table: ZoneTemp_1 / ZoneTemp_2 'Average zone air temperature', C (Ahern, O'Sullivan & Bruton 2023, Data in Brief 48:109208, doi:10.1016/j.dib.2023.109208)
- Handling: none -- described only. The zone points are not mapped (they belong to the reheat zones, not the AHU); described only.
43 rows from 2015, then a 904-day gap
- Issue:
stray-2015-rows - Columns:
Datetime - Evidence: The file starts with 43 rows on 2015-01-01 01:00-11:30 (14 of them carry return, damper, valve and supply readings, 34 a zone-1 reheat valve, no mixed or outdoor temperature); the next row is 2017-06-23 19:30.
- Contradicts: Data descriptor: 900-second (15-minute) time series readings (Ahern, O'Sullivan & Bruton 2023, Data in Brief 48:109208, doi:10.1016/j.dib.2023.109208)
- Handling: annotate -- left as published and recorded in the provenance. Ingested as published; analysis windows effectively start 2017-06-23.
5,205 timestamps are off the 15-minute grid
- Issue:
off-grid-timestamps - Columns:
Datetime - Evidence: 5,205 stamps (2020-06-23 to 2022-11-18) are not on a quarter hour, 5,063 of them one minute past, giving 5,065 pairs of 1-minute and 14-minute steps; 2020 holds 5,197 of them.
- Contradicts: Data descriptor: 900-second (15-minute) time series readings (Ahern, O'Sullivan & Bruton 2023, Data in Brief 48:109208, doi:10.1016/j.dib.2023.109208)
- Handling: annotate -- left as published and recorded in the provenance. Left as published; the 15-minute mean resample at ingest puts each reading in its quarter hour.
nist-heatpump-fdd: NIST residential heat pump, cooling-mode FDD lab tests (labelled faults)
Seventeen reduced-airflow tests are labelled as 110% airflow
- Issue:
indoor-airflow-level-mislabelled - Columns:
EF,Filename - Runs:
s14_short_ef110_named_ef80_90 - Evidence: 17 files of the 14 SEER unit (short line set) named EF-80%, EF-90% and EF-10% carry EF = 110 in the label column, the same as the 5 files named EF-110%. Their measured indoor airflow says otherwise: a median 839.9 scfm (EF-80% files, 73 rows) and 1137.9 scfm (EF-90%, 142 rows) against 1288.2 scfm fault-free (346 rows) and 1366.7 scfm for the EF-110% files -- 65%, 88% and 106% of fault-free.
- Contradicts: Description of data, 'Label Definitions': EF is the indoor airflow fault level, 100% = no fault, 90% = 10% reduced airflow; and the test file names (NIST HVAC&R Equipment Performance Group, FDD research data, doi:10.18434/M32132)
- Handling: exclude -- kept out of scoring / analysis. The 17 files are a separate run, ingested for inspection but never scored; the 5 EF-110% files keep their label. CAMBER does not relabel them (the true levels are not published).
The '50% blocked' condenser tests are labelled 28% blocked
- Issue:
condenser-blockage-level-mislabelled - Columns:
CF,Filename - Runs:
s14_long_cf72_named_cf50 - Evidence: 6 files named CF_50 (14 SEER, long line set) carry CF = 72 (28% of the coil blocked), the same label as the files named CF_28. They run hotter than those: discharge pressure median 494.4 psia vs 444.6 (CF_28 files) and 383.0 (fault-free), liquid subcooling 15.6 vs 9.5 and 8.2 F.
- Contradicts: Description of data, 'Label Definitions': CF is the outdoor-coil face area free of blockage, 70% = 30% blocked; and the test file names (NIST HVAC&R Equipment Performance Group, FDD research data, doi:10.18434/M32132)
- Handling: exclude -- kept out of scoring / analysis. The 6 files are a separate run, ingested for inspection but never scored; the CF_28 files keep their label.
Two files the publisher named JUNK are labelled as ordinary fault tests
- Issue:
junk-test-file - Columns:
Filename - Runs:
s16_long_cf67_junk,s16_short_uc95p4_junk - Evidence: Airtemp-CA-33-JUNK-COOL-LONG-170606a (15 rows, labelled CF = 67) and Airtemp-UC-95p4-JUNK-COOL-SHORT-170327a (5 rows, labelled UC = 95.4) sit among the test data. The first disagrees with its two sibling CF = 67 files: liquid subcooling median 9.0 vs 0.6 F, discharge 324 vs 400 psia.
- Contradicts: Description of data: every row is test data for the fault level in its label columns (NIST HVAC&R Equipment Performance Group, FDD research data, doi:10.18434/M32132)
- Handling: exclude -- kept out of scoring / analysis. Each JUNK file is a separate run, ingested for inspection but never scored.
Two short-line-set tests carry the long line-set flag
- Issue:
line-set-flag-contradicts-file-name - Columns:
Long/Short (0/1),Filename - Runs:
s16_long_ef109_uc95p4 - Evidence: Airtemp-UC-95p4-EA-109-COOL-SHORT-170317a and -170326b (151 rows) are named SHORT but carry Long/Short = 0 (long); the three Airtemp-UC-95p4-COOL-SHORT files of the same week carry 1.
- Contradicts: Description of data, 'Label Definitions': Long/Short (0/1), 0 = 50 ft total line set, 1 = 25 ft (NIST HVAC&R Equipment Performance Group, FDD research data, doi:10.18434/M32132)
- Handling: annotate -- left as published and recorded in the provenance. Left as published: the run id follows the flag. The fault labels (undercharge + high indoor airflow) are unaffected.
A repeated header row sits inside the data
- Issue:
embedded-header-row - Columns:
Filename - Evidence: Sheet row 6,396 (between the Airtemp-UC-94p5-COOL-LONG-170704a and Airtemp-UC-95p4-COOL-SHORT-170315a tests) repeats the 98 column names instead of values.
- Contradicts: Description of data: one header row, then one row per test point (NIST HVAC&R Equipment Performance Group, FDD research data, doi:10.18434/M32132)
- Handling: none -- described only. No run selects it (its Filename cell reads 'Filename'), so it is never ingested.
The 16 SEER unit's suction-port pressure column repeats the discharge pressure
- Issue:
suction-port-pressure-copies-discharge - Columns:
1710_ODSuctPort_psia,CompDisch_psia,1701_ODVapSV_psia - Evidence: On all 4,085 16 SEER rows 1710_ODSuctPort_psia equals CompDisch_psia exactly (256-507 psia), and the publisher's own CompSuct_Tsat_F is the R-410A dew temperature at 1701_ODVapSV_psia (median difference 0.002 F), not at the suction port (60 F off). On the 14 SEER unit the suction-port column is a real suction pressure (about 2.5% below the vapour service valve) and CompSuct_Tsat_F follows it (0.003 F).
- Contradicts: Description of data, column list: 1710_ODSuctPort_psia is the compressor suction-port pressure (NIST HVAC&R Equipment Performance Group, FDD research data, doi:10.18434/M32132)
- Handling: annotate -- left as published and recorded in the provenance. CAMBER maps suction_pressure to the vapour service valve pressure (1701_ODVapSV_psia) for both units -- the pressure NIST itself used for the 16 SEER unit -- and ignores the suction-port column. Until 0.93 the mapping used the suction-port column, so a 16 SEER suction pressure read as the discharge pressure.
Four fault-free 14 SEER files do not look like steady, fully charged cooling
- Issue:
fault-free-points-not-steady-cooling - Columns:
CompSuct_Suph_F,CompSuct_Tsat_F,CompDisch_Suph_F,ODLiqSV_Tsub_F,Filename - Evidence: Goodman14SEER_NFTests-LONG-COOL-161212b and -161213a (16 and 20 rows, long line set) run a suction superheat of -16.3 and -19.8 F and a discharge superheat of 13-18 F with the evaporator at 65-66 F; every other fault-free row runs 7-34 F of suction and 35-88 F of discharge superheat, and 99% of them evaporate below 61 F. Goodman14SEER_NFTests-160315a and -160315b (2 and 4 rows, short line set) have no liquid subcooling (median 0.0 and -0.2 F) where the other short-line-set fault-free files median 8.8 F.
- Contradicts: Description of data, 'Label Definitions': NF = 1 marks a fault-free test at the nominal charge and airflow (NIST HVAC&R Equipment Performance Group, FDD research data, doi:10.18434/M32132)
- Handling: annotate -- left as published and recorded in the provenance. Left as published and scored as fault-free, so they count against CAMBER's false-positive rate: in the leave-one-file-out scoring the charge detector fires on the two no-subcooling files and the discharge-superheat detector on the two negative-superheat files.
nist-ibal: NIST IBAL lab chiller with refrigerant pressures (real, unlabelled)
The Experiments page's CSV export has no time column
- Issue:
experiments-page-export-has-no-clock - Columns:
time - Evidence: Download CSV on the Experiments page returns 'date,run' plus the measurements and no time of day: for experiment 1744 it gave 8,737 rows (24.3 h at 10 s) all stamped only 2026-01-19 / run 1. The Measurements page's export of the same measurements carries a 'time' column with UTC offsets.
- Contradicts: Record description: 'select that button and a csv file of the data in the plot is automatically generated' (the plot has a time axis); data 'collected every 10 s' (NIST IBAL record, Pertzborn et al., doi:10.18434/mds2-2751)
- Handling: none -- described only. The download instructions use the Measurements page. An Experiments-page export cannot be ingested (no timestamp column).
Experiment start times are Eastern Standard Time all year
- Issue:
experiment-table-clock-is-standard-time - Columns:
start_time (portal experiment table),time - Evidence: Experiment 1689 is listed as starting 2025-06-28 13:24:31; its first data row is 2025-06-28 14:24:34-04:00 (18:24:34 UTC = 13:24:34 EST). Winter experiments agree to the second (e.g. 2026-01-18 00:00:03-05:00).
- Contradicts: IBAL portal experiment table (start times given without a zone) against the data's own UTC offsets (NIST IBAL record, Pertzborn et al., doi:10.18434/mds2-2751)
- Handling: annotate -- left as published and recorded in the provenance. The data are converted to the Eastern wall clock (EDT in summer); add an hour to a summer experiment's listed start time to find it in the store.
A few timestamps lack fractional seconds
- Issue:
mixed-precision-timestamps - Columns:
time - Evidence: 12 of 454,801 stamps in the full export (e.g. '2025-03-25 14:45:03-04:00') have no fractional seconds while the rest carry milliseconds; pandas' inferred format turns exactly those 12 into missing values.
- Contradicts: Record description: sensor data every 10 s, one timestamp per sample (NIST IBAL record, Pertzborn et al., doi:10.18434/mds2-2751)
- Handling: annotate -- left as published and recorded in the provenance. The ingest pins timestamp_format ISO8601, which parses both forms; nothing is lost.
37 samples share one timestamp
- Issue:
repeated-timestamp - Columns:
time - Evidence: 37 consecutive rows of the full export are stamped 2025-06-04 16:07:43.774-04:00 with differing values (discharge pressure 295.4 then 296.9 psi); every other stamp is unique, 10 s apart.
- Contradicts: Record description: data collected every 10 s (NIST IBAL record, Pertzborn et al., doi:10.18434/mds2-2751)
- Handling: annotate -- left as published and recorded in the provenance. The ingester keeps the first of duplicated stamps (36 samples dropped), as for every catalog entry.
The refrigerant sensors have no instrument or calibration metadata
- Issue:
refrigerant-sensors-undocumented - Columns:
ch1_p_dis,ch1_p_suc,ch1_sc_rtd,ch1_sh_rtd - Evidence: In the portal's measurement metadata the two pressure transducers and the liquid- / suction-line RTDs have no instrument model, serial, calibration date or accuracy (all empty), while the plant's water RTDs list a model, a 2020-2023 calibration and +-0.18-0.21 F. All four refrigerant-line RTDs (both chillers) share one scaling (a0 3.2902, a1 0.9651) where each calibrated RTD has its own. In an export of 2023-10-01 to 2025-02-15 the pressures first report on 2024-04-10 and the liquid-line RTD on 2025-01-28 (UTC).
- Contradicts: Record description: 'Each of the sensors/actuators has associated metadata' (NIST IBAL record, Pertzborn et al., doi:10.18434/mds2-2751)
- Handling: annotate -- left as published and recorded in the provenance. Left as published. Drift detectors compare the chiller with its own baseline, so an uncalibrated offset matters less than for an absolute threshold; the standing-pressure check (R-410A at the suction-line temperature) confirms the pressures are gauge readings.
Refrigerant pressures read below a perfect vacuum
- Issue:
refrigerant-pressure-below-vacuum - Columns:
ch1_p_dis,ch1_p_suc - Evidence: In the full export 1,198 discharge-pressure samples (median -70.2 psig, on 3 days: 2025-02-05, 2025-08-21, 2025-09-17) and 1,396 suction-pressure samples (median -32.8 psig, on 7 days from 2025-01-28 to 2025-09-17) sit below -14.7 psig, i.e. below zero absolute pressure, which no gauge reading can reach; each channel holds one fixed value there, the signature of an unpowered or disconnected transducer. The default export has none.
- Contradicts: Record description: measured sensor data (pressures reported in psi; gauge readings, see the mapping) (NIST IBAL record, Pertzborn et al., doi:10.18434/mds2-2751)
- Handling: annotate -- left as published and recorded in the provenance. Left as published. CAMBER's saturation transform has no temperature for a pressure below vacuum, so derived subcooling, superheat and approach decline on those samples (NaN) instead of taking an extrapolated value, and the pressure roles' physical bounds (-15 psig) flag them in sensor health.
robod: ROBOD: room-level occupancy and building operation (Singapore, 5 rooms)
Indoor CO2 reads below outdoor CO2 and is clipped at 400 ppm
- Issue:
indoor-co2-below-outdoor - Columns:
indoor_co2 [ppm],outdoor_co2 [ppm] - Evidence: Indoor CO2 is below the outdoor reading in 78.8 / 75.7 / 51.0 / 54.2 / 75.8% of rows (Room1-5; median deficit 31-45 ppm, up to 101 ppm), and in 55-72% of occupied rows; outdoor CO2 spans 438.6-509.6 ppm (median 471.3). No indoor value is below 400: 0.11-1.16% of rows read exactly 400 (Room3: 97 rows at 400, then 27 / 58 / 89 in the 400-401 / 401-405 / 405-410 ppm bins).
- Contradicts: Data descriptor: the rooms are supplied by a dedicated outdoor-air system, so incoming air carries the outdoor CO2 level (a ventilated room cannot sit below it); sensor table: indoor CO2 range 400-5000 ppm (±75 ppm or 10%) (Tekler et al. 2022, Building Simulation 15:2127, doi:10.1007/s12273-022-0925-9)
- Handling: annotate -- left as published and recorded in the provenance. Left as published. The two sensors disagree by more than their stated accuracy (a relative calibration offset), and indoor values at 400 are the sensor's range floor, not a measurement: co2_ventilation's 'CO2 near outdoor' (over-ventilation) reading is biased toward over-ventilation here.
Supply airflow reads above zero with the air handler off
- Issue:
airflow-with-fan-off - Columns:
supply_air_flow [CMH] - Runs:
room3,room4,room5 - Evidence: With the air-handler fan below 1 Hz, supply_air_flow reads a median 44.5 m3/h (Room4, above zero in 87% of fan-off rows) and 111 m3/h (Room5, 76.6%); Room3 reads above zero in 32.6% of its fan-off rows.
- Contradicts: Sensor table: supply air flow from the VAV box (Johnson Controls), 0-3375 m3/h ±15% (Tekler et al. 2022, Building Simulation 15:2127, doi:10.1007/s12273-022-0925-9)
- Handling: annotate -- left as published and recorded in the provenance. Left as published (a flow-sensor zero offset); rules that read oa_airflow also see the derived fan status, so fan-off hours can be excluded.
Room5 airflow and damper are missing for 9 of its 47 days
- Issue:
room5-airflow-missing-9-days - Columns:
supply_air_flow [CMH],damper_position [%] - Runs:
room5 - Evidence: Both columns are blank on 9 weekdays, 2021-09-21 to 2021-09-24 and 2021-09-27 to 2021-10-01: 2,580 rows, 19.1% of Room5's 13,536; every other column of those rows is present.
- Contradicts: Data descriptor / README: 47 days of all data categories for Room 5 (Tekler et al. 2022, Building Simulation 15:2127, doi:10.1007/s12273-022-0925-9)
- Handling: none -- described only. Left missing; the analyses see those days without an airflow or damper value.
Cooling-valve position reads above the command at zero
- Issue:
valve-position-offset - Columns:
cooling_coil_valve_position [%],cooling_coil_valve_command [%] - Runs:
room3,room4,room5 - Evidence: Position and command correlate at r = 1.000 but position reads about 1.7 points (Room3) and 7.8 points (Room4/5) at a 0% command (median +6.0 above command when the command is above 5%).
- Contradicts: Sensor table: cooling-coil valve position and command, 0-100% (Johnson Controls) (Tekler et al. 2022, Building Simulation 15:2127, doi:10.1007/s12273-022-0925-9)
- Handling: none -- described only. The command is mapped (cool_valve); the position feedback is not, so the offset cannot read as a leaking valve.
sdu-ou44: SDU OU44: room CO2, VAV damper and camera occupant counts (Denmark, 3 rooms)
ROOM1 CO2 is forward-filled over gaps of 347 and 1,016 minutes
- Issue:
room1-co2-filled-over-long-gaps - Columns:
room_1 (co2_room_1.csv) - Runs:
room1 - Evidence: In the original stream ROOM1 CO2 has 209 readings on DayId 7 (last at 18:12:46 UTC) and 83 on DayId 30 (last at 07:03:34 UTC); the filled series holds one value for 347 and 1,016 consecutive minutes. Rooms 2 and 3 never gap more than 20 minutes.
- Contradicts: Data descriptor, day selection: days where the CO2 stream had more than three missing readings in a row were not considered (gaps of at most 15 minutes) (Schwee et al. 2019, Sci Data 6:287, doi:10.1038/s41597-019-0274-4)
- Handling: fix -- corrected at ingest (skipped by
--no-corrections). The two held stretches are masked to missing (mask quirks on the ROOM1 run, in the synthetic clock); --no-corrections keeps them.
The filled series lag the original readings by one minute
- Issue:
filled-data-lags-one-minute - Columns:
co2_room_x,vav_room_x,temperature_room_x,occupant_count_room_x - Evidence: The filled value at minute m+1 equals the original reading taken inside minute m in 99.9% of CO2 rows and 100% of camera-count rows (a reading at 00:02:12 appears from 00:03:00); before each day's first CO2 reading (median 143-163 s after midnight) the fill is neither that reading nor the previous day's last.
- Contradicts: Data descriptor: forward fill then backward fill of the original streams to minute-wise sampling (Schwee et al. 2019, Sci Data 6:287, doi:10.1038/s41597-019-0274-4)
- Handling: annotate -- left as published and recorded in the provenance. Left as published: a one-minute shift is invisible at the 15-minute resample.
The filled files hold 44 days, not the 47 the descriptor counts
- Issue:
upsampled-row-count - Columns:
filleddata/* - Evidence: Every filled file has 63,360 rows = 44 days x 1,440 minutes (DayId 0-43).
- Contradicts: Data descriptor: the upsampled dataset has 67,680 readings per stream (47 days) (Schwee et al. 2019, Sci Data 6:287, doi:10.1038/s41597-019-0274-4)
- Handling: none -- described only. Nothing to correct; the catalog describes the 44 days that are published.
The README's file names, column name and workday values differ from the data
- Issue:
readme-names-and-values - Columns:
README.txt,DayId,Workday - Evidence: 3 of the README's file patterns do not exist as named (occupant_data_room_x.csv is occupant_count_room_x.csv, vav_data_room_x.csv is vav_room_x.csv, illuminance_room_x.csv is Illuminance_room_x.csv); the day column is DayId, not DayID; Workday holds True/False (True on all 44 days), not 1/0.
- Contradicts: Dataset README (published with the data and described by the data descriptor) (Schwee et al. 2019, Sci Data 6:287, doi:10.1038/s41597-019-0274-4)
- Handling: none -- described only. The catalog names the files and columns as published.
The published Brick model has a room 4 and one AHU for every VAV
- Issue:
brick-model-contradicts-rooms - Columns:
brick_graph.ttl - Evidence: brick_graph.ttl (legacy BrickFrame namespace, identical in original/ and filleddata/) declares co2_room_4, vav_room_4 and other room-4 points that have no data, one AHU (/ahus/1) feeding VAVs 1-4, and measurements in files that do not exist (lux_room_x.csv, occ_count_room_x.csv).
- Contradicts: Data descriptor: no two rooms are served by the same AHU nor VAV damper position (Schwee et al. 2019, Sci Data 6:287, doi:10.1038/s41597-019-0274-4)
- Handling: none -- described only. Not used: the entry groups the per-point files by room itself.
Occupant counts are above zero at night
- Issue:
phantom-night-occupants - Columns:
occupant_count_room_x - Evidence: Between 00:00 and 04:00 UTC (01-06 local) the count is above zero in 13.4 / 51.8 / 26.1% of minutes (max 2 / 7 / 8) in ROOM1 / 2 / 3, and above zero at 02:00 UTC on 6 / 23 / 13 of the 44 days.
- Contradicts: Data descriptor: occupant counts from overhead cameras corrected by PLCount (RMSE 0.075) (Schwee et al. 2019, Sci Data 6:287, doi:10.1038/s41597-019-0274-4)
- Handling: annotate -- left as published and recorded in the provenance. Left as published; the derived OCCUPIED flag (count above 0) counts those minutes as occupied, which the DCV rule's occupied-hours window mostly excludes.
ornl-frp-ops: ORNL FRP-2 multizone office: one RTU and ten VAV boxes under seven operating scenarios
The WH_* energy columns are average power in W, not Wh per minute
- Issue:
wh-columns-are-average-power - Columns:
WH_RTU_Total,WH_RTU_Comp1,WH_RTU_Comp2,WH_RTU_Sup_Fan,WH_RTU_VAV* - Evidence: Read as Wh per 1-minute interval, the supply fan's median of 1,795 would be 108 kW (the RTU is rated 44 kW); read as W it is 1.8 kW, compressors 3.6-4.8 kW on, reheat 0.4-5 kW per box. The values step in multiples of 2.77 (idle readings 2.77 / 5.54 / 8.31) and are not cumulative (15-55% of steps fall).
- Contradicts: Data descriptor Table 7 and Building_Information.csv: energy consumption in Wh at 1-minute resolution (Yoon et al. 2022, Sci Data 9:775, doi:10.1038/s41597-022-01858-6)
- Handling: annotate -- left as published and recorded in the provenance. Left as published; the mapped fan and reheat power columns are declared in W (converted to kW), and the fan / compressor status are derived above 200 W.
RTU supply airflow is 24-26% above the sum of the ten box airflows
- Issue:
rtu-flow-exceeds-box-flows - Columns:
AF_RTU,AF_VAV_* - Evidence: AF_RTU divided by the sum of AF_VAV_102-206 has a median of 1.24-1.26 in every scenario with the fan running (p5 1.21, p95 1.27).
- Contradicts: Data descriptor, cooling-season analysis: the RTU supply airflow rate was the same as the supply airflow from the 10 VAV boxes, with no duct leakage (Yoon et al. 2022, Sci Data 9:775, doi:10.1038/s41597-022-01858-6)
- Handling: none -- described only. Left as published: a 25% airflow mismatch is either duct leakage or a sensor calibration difference, and the data cannot say which.
The pre-heating test covers 5 days, not the documented 9
- Issue:
pre-heating-period-is-5-days - Columns:
TIMESTAMP - Runs:
rtu__pre_heating,vav102__pre_heating,vav103__pre_heating,vav104__pre_heating,vav105__pre_heating,vav106__pre_heating,vav202__pre_heating,vav203__pre_heating,vav204__pre_heating,vav205__pre_heating,vav206__pre_heating,weather__pre_heating - Evidence: Building_Pre_Heating.csv and Weather_Pre_Heating.csv run from 2022-01-19 00:00 to 2022-01-23 23:59 (7,200 one-minute rows).
- Contradicts: Data descriptor Table 2: pre-heating test 15/01/22-23/01/22 (Yoon et al. 2022, Sci Data 9:775, doi:10.1038/s41597-022-01858-6)
- Handling: none -- described only. Nothing to correct; the scenario is the five days published.
Barometric pressure reads 0 Pa in two weather files
- Issue:
barometric-pressure-zero - Columns:
BP - Evidence: BP = 0 in 54 rows of Weather_FF_Heating.csv and 52 rows of Weather_Base_Heating.csv; elsewhere it reads about 98,500 Pa.
- Contradicts: Data descriptor Table 8: barometric pressure 500-1,100 hPa (CS106) (Yoon et al. 2022, Sci Data 9:775, doi:10.1038/s41597-022-01858-6)
- Handling: none -- described only. Not mapped; nothing in CAMBER reads the barometric pressure.
Global solar radiation is negative at night
- Issue:
negative-night-solar - Columns:
Glo_Solar - Evidence: Glo_Solar falls to -34 W/m2; the night median is -20.5 W/m2 (setback heating test) and -18.6 W/m2 (pre-heating test), with 5,500 rows below -5 W/m2 in the setback heating test.
- Contradicts: Data descriptor Table 8: global solar radiation, Eppley SPP, 0-2,000 W/m2 range (Yoon et al. 2022, Sci Data 9:775, doi:10.1038/s41597-022-01858-6)
- Handling: none -- described only. Not mapped; a pyranometer's night-time thermal offset, left as published.
ornl-supermarket-fdd: ORNL supermarket refrigeration FDD tests (CO2 booster rack, labelled faults; reference only)
Two fault files carry minute stamps for 1-second and 3-second data
- Issue:
minute-stamps-in-two-files - Columns:
Timestamp - Runs:
lt__ice_accumulation,mt__ice_accumulation,lt__evap_valve_failure,mt__evap_valve_failure - Evidence: Fault2_IceAccumulation.csv has 26,395 rows on 1,440 distinct stamps (up to 19 per minute) and Fault3_EvapValveFailure.csv 81,280 rows on 1,440 stamps (up to 57 per minute), formatted M/D/YYYY H:MM; the other nine files use MM/DD/YYYY HH:MM:SS with one row per stamp.
- Contradicts: Data descriptor Table 4: sample time 1 s (Fault3) and 3 s (Fault2) (Sun et al. 2021, Sci Data 8:144, doi:10.1038/s41597-021-00927-6)
- Handling: annotate -- left as published and recorded in the provenance. Read with their own timestamp format; CAMBER keeps the first row of each minute, so these two runs carry one sample per minute (15 per 15-minute bin).
The LT expansion-valve failure starts at about 13:56
- Issue:
valve-failure-starts-mid-day - Columns:
T-LTcase-EEVout,T-LTcase-Sup,T-LT-Suc - Runs:
lt__evap_valve_failure,mt__evap_valve_failure - Evidence: Against baseline C, the hourly means differ by less than 1 F until 13:56; after it the LT EEV outlet rises by up to 78 F, the LT case supply air by up to 69 F and the LT suction temperature by up to 31 F for the remaining 603 minutes.
- Contradicts: Data descriptor Table 4: Fault3_EvapValveFailure.csv is the fault test (the whole file) (Sun et al. 2021, Sci Data 8:144, doi:10.1038/s41597-021-00927-6)
- Handling: annotate -- left as published and recorded in the provenance. Left as published; the whole day carries the label.
BaselineTestE's MT case return-air temperature is 40 F too warm
- Issue:
baseline-e-mt-return-air - Columns:
T-MTCase-Ret - Runs:
mt__baseline_e - Evidence: T-MTCase-Ret has a median of 94.1 F in BaselineTestE against 44.7-52.3 F in every other file (including Fault5, the day it is the baseline for).
- Contradicts: Data descriptor: each baseline test ran with operating conditions similar to those of its fault test (MT case discharge air setpoint 30 F) (Sun et al. 2021, Sci Data 8:144, doi:10.1038/s41597-021-00927-6)
- Handling: fix -- corrected at ingest (skipped by
--no-corrections). Dropped for that run (a drop quirk); --no-corrections keeps it.
The published superheat, subcooling and capacity columns are empty
- Issue:
derived-columns-empty - Columns:
SupHEvap1,SupHEvap2,SubcoolCond1,SubcoolCond2,SupHCompSuc,EER - Evidence: 21 of the 23 columns after the unnamed column 161 (SupHEvap1/2, SubClComCond, SubcoolCond1/2, SuncoolLiq, RefHSct, RefHLiq, Tsetpt, RHsetpt, AirHRet, AirHSup, Tstat*, CapaAirside, CapaRefrside, EnergyBalance, EERA, EER) are blank in all 11 files; SupHCompSuc is 0 at its 95th percentile everywhere.
- Contradicts: Data descriptor, Data Records: evaporator exiting superheat among the variables representing evaporator characteristics (Sun et al. 2021, Sci Data 8:144, doi:10.1038/s41597-021-00927-6)
- Handling: none -- described only. Not mapped; the entry maps no superheat or subcooling role.
Several temperature and flow channels hold a -98,590 sentinel
- Issue:
sentinel-temperatures - Columns:
T-GC-Out,T-BP-EEVin,T-GC-Fan1-In,T-spare-*,F-LT-BPHX,F-MT-BPHX - Evidence: Values near -98,590 fill T-GC-Out in 24-99% of rows (99% in Fault1), T-BP-EEVin in 1-34%, T-GC-Fan1-In in 17% of baselines A and B (its other values run 40-1,027), and 100% of the five spare channels and both BPHX flow meters; the LT mass flow M-LTcooler is a constant -1.25.
- Contradicts: Data descriptor Table 5: thermocouples -270 to 400 C; Coriolis mass flow meters 0-10 kg/min (Sun et al. 2021, Sci Data 8:144, doi:10.1038/s41597-021-00927-6)
- Handling: none -- described only. None of these channels is mapped; the ambient is T-GC-Fan2-In, as the publisher's script uses.
ornl-frp-vav: ORNL multi-zone VAV terminal faults (real building, labelled)
The 'biased airflow sensor' runs log the true flow at a moved minimum setpoint
- Issue:
airflow-bias-emulated-by-setpoint - Columns:
VAV Box - Room 205: Discharge Airflow Rate - Runs:
a1_bias_*,a2_bias_* - Evidence: Occupied-hour median discharge flow of the Room 205 box: 10.57 / 10.61 m3/min fault-free (sets 1 / 2), 14.92 / 15.01 at +40%, 12.68 / 12.77 at +20%, 8.37 / 8.34 at -20% and 6.38 / 6.49 at -40% -- the 10.5 m3/min minimum moved by the bias, delivered and logged. A sensor reading 40% high would log about the setpoint while delivering about 29% less. The workbooks carry no airflow setpoint column.
- Contradicts: Table 4 (VAV airflow sensor biased by +40/+20/-20/-40%), whose data the Methods describe as emulated by altering the minimum airflow value in the BAS (Im, P., Jung, S. & Yoon, Y. 2025, Datasets of Faults in Variable Air Volume Terminal Units in a Multi-Zone Commercial Building, Sci Data 12:763, doi:10.1038/s41597-025-05063-z)
- Handling: annotate -- left as published and recorded in the provenance. Scored under the published label (airflow_sensor_bias). Read '+40%' as 'the box delivers 40% more than its design minimum', the opposite sign of a real sensor reading 40% high; with no airflow setpoint logged, airflow_tracking cannot run.
Duct static collapses in five damper-test days (an unlabelled upstream condition)
- Issue:
duct-static-collapse-in-damper-runs - Columns:
RTU: Static Pressure,RTU: Supply Air Fan Electricity,VAV Box - Room * : VAV Damper Opening - Runs:
d1_stuck_080,d1_stuck_100,d2_stuck_040,d2_stuck_080,d2_stuck_100 - Evidence: Occupied-hour median duct static 38 / 39 Pa (set 1: stuck at 80 / 100%) and 41 / 35 / 40 Pa (set 2: stuck at 40 / 80 / 100%) against 148-249 Pa in the other 27 runs; from about 10:00 the supply-fan draw falls to ~1.0 kW (1.4-1.7 kW in the other runs) while a median 5-7 of the 10 boxes sit at or above 95% open. In set 1 the stuck-at-100% box gets 7.54 m3/min, less than the stuck-at-60% box's 12.62.
- Contradicts: Methods, basic test settings applied consistently across all scenarios (supply fan static pressure set at 249 Pa) (Im, P., Jung, S. & Yoon, Y. 2025, Datasets of Faults in Variable Air Volume Terminal Units in a Multi-Zone Commercial Building, Sci Data 12:763, doi:10.1038/s41597-025-05063-z)
- Handling: annotate -- left as published and recorded in the provenance. Left as published and scored under the damper labels. In these runs the box under test is also starved by the air handler: every box's flow is limited, so a fleet-level rule may (correctly) point upstream instead of at the stuck damper.
Mixed air reads below return air in cooling with the OA damper at its minimum
- Issue:
mixed-air-below-return-in-cooling - Columns:
RTU: Mixed Air Temperature,RTU: Return Air Temperature - Runs:
d1_*,d2_* - Evidence: In the August damper runs, over the 1,915 occupied fan-on minutes with the outdoor air at least 5 C warmer than the return (median 6.0 C) and the OA damper at its 10% minimum, MAT - RAT has a median of -0.31 C (p10 -0.44, p90 -0.17) and is negative in 99.8% of them; a 10% OA share should put MAT about +0.6 C above RAT. In winter the same 10% damper gives a temperature-balance OA fraction of 0.17.
- Contradicts: Table 3 (minimum 10% OA damper opening when occupied) and Table 9 (mixed, return and outdoor temperatures within +-0.1 C) (Im, P., Jung, S. & Yoon, Y. 2025, Datasets of Faults in Variable Air Volume Terminal Units in a Multi-Zone Commercial Building, Sci Data 12:763, doi:10.1038/s41597-025-05063-z)
- Handling: annotate -- left as published and recorded in the provenance. Left as published. An OA fraction from the mixing-box temperature balance reads ~0% in these summer runs; that is a sensor-placement artefact, not missing outdoor air.
rbc-g36-ahu: RBC and Guideline 36 AHU fault simulations (labelled, five-zone VAV) (research-only)
The archive bundles a folder of third-party ASHRAE 1312-RP data under the record's single CC BY licence
- Issue:
bundled-1312-rp-folder - Columns:
01_RBC-ASHRAE1312/ (every file in the folder) - Evidence: The 928.7 MB archive holds 801 entries; 324 of them (143.1 MB of the 6,188.7 MB uncompressed, 23.0 MB compressed) sit in 01_RBC-ASHRAE1312: 200 under Real/ (dated folders such as Real/Summer/20070820/), 121 under Simulation/, plus 00_explanations.pdf and FeaturesNames.xls. The folder name identifies the data as ASHRAE research project 1312-RP's. The record states one licence, CC BY 4.0, for all 801 entries and names no separate terms, source or permission for that folder.
- Contradicts: the dataset record's single CC BY 4.0 statement, which covers every file in the archive, and the data descriptor's description of the collection as the authors' labelled AHU datasets (Ghalamsiah, N., Wen, J., Li, G., Chen, Y., Lu, X., Fu, Y., Chu, M. & O'Neill, Z., Labeled Datasets for Air Handling Units Operating in Faulted and Fault-free States, Sci Data 13:15, doi:10.1038/s41597-025-06179-y)
- Handling: exclude -- kept out of scoring / analysis. No run reads the folder, so it is never extracted or ingested. Because the fetch still downloads it inside the archive, and CAMBER cannot vouch for its open licence, the maintainer holds the whole entry research-only (access_reason): fetch and ingest need --accept-noncommercial, the acknowledgement is recorded, and every report carries the do-not-redistribute banner with the reason. CAMBER does not judge the folder's licence; it declines to vouch for it.
Four zone damper-loop tuning runs are copies (of each other, or of the baseline)
- Issue:
damper-control-runs-duplicated - Columns:
South Zone VAV Damper Position,East Zone VAV Damper Position - Runs:
c1_ConVAVSoukDam_5,s1_Convavsoukdam_5,h1_Convaveaskdam_05,h1_Convaveaskdam_5 - Evidence: In 04_G36-1wk the cooling-season ConVAVSoukDam_05.csv and _5.csv are byte-identical (same CRC-32 and size), as are the shoulder-season Convavsoukdam_05 / _5; the heating-season Convaveaskdam_05.csv and _5.csv are byte-identical to that season's BaselineSystem.csv (0 of 114 columns differ in any of 10,081 rows). The cooling and shoulder copies do carry a fault: the South damper reverses direction ~3,900 times in the week against ~400-500 in the baseline.
- Contradicts: G36-1wk explanations Table 2 (zone VAV damper-loop gain faults at two distinct intensities, 0.5 and 5, in each season) (Ghalamsiah, N., Wen, J., Li, G., Chen, Y., Lu, X., Fu, Y., Chu, M. & O'Neill, Z., Labeled Datasets for Air Handling Units Operating in Faulted and Fault-free States, Sci Data 13:15, doi:10.1038/s41597-025-06179-y)
- Handling: exclude -- kept out of scoring / analysis. Cooling and shoulder: the _05 run is kept under its label and the identical _5 copy excluded (the data cannot say which gain it is). Heating: both runs are the fault-free baseline and are excluded; the ingester also skips byte-identical members.
Two cooling-season plant runs end early (all-empty rows)
- Issue:
truncated-cooling-runs - Columns:
all columns - Runs:
c1_ChiNonCon_25,c1_ChiConValLea_01 - Evidence: 04_G36-1wk/CoolingSeason: ChiNonCon_25.csv has 6,515 of its 10,081 rows empty from t = 17,839,560 s and ChiConValLea_01.csv 2,360 rows empty from t = 18,088,860 s (5.7 MB and 10.9 MB against 13.5-13.6 MB for the same runs in the shoulder season).
- Contradicts: G36-1wk explanations Table 1 (every run is one week of 1-minute data) (Ghalamsiah, N., Wen, J., Li, G., Chen, Y., Lu, X., Fu, Y., Chu, M. & O'Neill, Z., Labeled Datasets for Air Handling Units Operating in Faulted and Fault-free States, Sci Data 13:15, doi:10.1038/s41597-025-06179-y)
- Handling: annotate -- left as published and recorded in the provenance. Left as published: the rows are empty, so these plant runs cover ~2.5 and ~5.4 days.
The one-week G36 runs are occupied 06:00-19:00, not 07:00-20:00
- Issue:
g36-1wk-occupied-06-to-19 - Columns:
Indicator if the System Operates in Occupied Mode (0: unoccupied mode, 1: occupied mode) - Runs:
c1_*,h1_*,s1_* - Evidence: In the 04_G36-1wk baselines the occupied-mode indicator is 1 from 06:00 to 18:59 on all 7 days in the cooling and shoulder seasons and from 05:59 to 18:58 in the heating season (the clock read from 1 January) -- the same window in winter and summer, so not a daylight-saving shift.
- Contradicts: G36-1wk explanations Table 2 (system operated in occupied mode from 7 a.m. to 8 p.m. each day) (Ghalamsiah, N., Wen, J., Li, G., Chen, Y., Lu, X., Fu, Y., Chu, M. & O'Neill, Z., Labeled Datasets for Air Handling Units Operating in Faulted and Fault-free States, Sci Data 13:15, doi:10.1038/s41597-025-06179-y)
- Handling: annotate -- left as published and recorded in the provenance. Left as published; the occupancy point is mapped, so occupancy-aware rules use the simulation's own schedule.
The zone 'VAV Damper Control Signal' is a normalised airflow setpoint
- Issue:
zone-damper-signal-is-airflow-setpoint - Columns:
<Zone> Zone VAV Damper Control Signal - Evidence: Against the zone's discharge airflow the 'damper control signal' correlates 0.98-1.00 with a constant flow/signal ratio per zone (0.906 / 0.951 / 0.702 / 0.954 / 4.576 m3/s East / South / West / North / Core), while the damper position itself sits at a fan-on median of 0.69-0.90 (cooling-season baseline).
- Contradicts: conventions.pdf / column header (fraction: 0 damper should be fully closed to 1 fully open) (Ghalamsiah, N., Wen, J., Li, G., Chen, Y., Lu, X., Fu, Y., Chu, M. & O'Neill, Z., Labeled Datasets for Air Handling Units Operating in Faulted and Fault-free States, Sci Data 13:15, doi:10.1038/s41597-025-06179-y)
- Handling: annotate -- left as published and recorded in the provenance. Not mapped: the damper role reads the damper position column. With no documented nominal flows CAMBER derives no airflow setpoint, so airflow_tracking and the static-pressure censuses decline.
HIL runs use -123456 for missing values
- Issue:
hil-sentinel-values - Columns:
AHU Mixed Air Temperature,AHU Supply Air Fan Status,AHU Supply Air Temperature,True Value for AHU Outdoor Air Damper Stuck Position,time (s) - Runs:
hil_* - Evidence: In 08_G36-HIL -123456 fills 29 columns in all 289 rows of every run (including the true OA-damper position), 28-38 rows of the AHU temperature, fan, valve, static and occupancy columns in Cyber_Device_Reinit_Attack, and 2-18 rows of most columns (time included) in Cyber_Network_DOS_Attack.
- Contradicts: Sci Data descriptor, Methods (HIL data exported through the BAS; physical quantities in the stated units) (Ghalamsiah, N., Wen, J., Li, G., Chen, Y., Lu, X., Fu, Y., Chu, M. & O'Neill, Z., Labeled Datasets for Air Handling Units Operating in Faulted and Fault-free States, Sci Data 13:15, doi:10.1038/s41597-025-06179-y)
- Handling: fix -- corrected at ingest (skipped by
--no-corrections). Masked to missing at ingest (mask quirk: value equals -123456) on every mapped column of the HIL runs; --no-corrections keeps the sentinel.
The HIL network denial-of-service run is short and sentinel-ridden
- Issue:
hil-dos-run-corrupted - Columns:
time (s),all columns - Runs:
hil_Cyber_Network_DOS_Attack - Evidence: Cyber_Network_DOS_Attack.csv has 278 of the 289 five-minute rows of the other HIL runs, 2 of them with a -123456 clock value (read as 34 h before the run starts).
- Contradicts: G36-HIL explanations Table 1 (one day at 5-minute sampling) (Ghalamsiah, N., Wen, J., Li, G., Chen, Y., Lu, X., Fu, Y., Chu, M. & O'Neill, Z., Labeled Datasets for Air Handling Units Operating in Faulted and Fault-free States, Sci Data 13:15, doi:10.1038/s41597-025-06179-y)
- Handling: exclude -- kept out of scoring / analysis. Ingested for inspection; not scored.
The HIL clock starts at 1 January although the run uses August weather
- Issue:
hil-clock-origin - Columns:
time (s) - Runs:
hil_* - Evidence: Every 08_G36-HIL run's clock runs 0-86,400 s (1 January on a year clock).
- Contradicts: G36-HIL explanations (the test day uses 1 August weather) (Ghalamsiah, N., Wen, J., Li, G., Chen, Y., Lu, X., Fu, Y., Chu, M. & O'Neill, Z., Labeled Datasets for Air Handling Units Operating in Faulted and Fault-free States, Sci Data 13:15, doi:10.1038/s41597-025-06179-y)
- Handling: annotate -- left as published and recorded in the provenance. Left as published: with CAMBER's 2025-01-01 origin the HIL runs are dated 1 January.
RBC-5wk is Latin-1 with three renamed columns; the Cyber headers double-encode
- Issue:
rbc-5wk-encoding-and-names - Columns:
South Zone Discharge Air Temperature,North Zone Discharge Air Temperature,AHU Supply Air Fan Speed - Runs:
r5_*,cy_* - Evidence: 03_RBC-5wk headers are Latin-1 (a UTF-8 read fails on the degree sign) and name 3 of the 114 columns differently ('South/North Zone Discharge Air Temperature', 'AHU Supply Air Fan Speed'); the 8 07_G36-Cyber headers spell the degree sign '°' in 37 columns.
- Contradicts: conventions.pdf (the six simulated datasets share the same list of 114 features) (Ghalamsiah, N., Wen, J., Li, G., Chen, Y., Lu, X., Fu, Y., Chu, M. & O'Neill, Z., Labeled Datasets for Air Handling Units Operating in Faulted and Fault-free States, Sci Data 13:15, doi:10.1038/s41597-025-06179-y)
- Handling: annotate -- left as published and recorded in the provenance. Read as published: the RBC-5wk runs declare encoding latin-1 and the mapping lists every spelling.
The 5-week and RBC summer baselines cannot hold the zones at setpoint
- Issue:
summer-baselines-capacity-limited - Columns:
<Zone> Zone Room Temperature,<Zone> Zone VAV Damper Position - Runs:
g5_BaselineSystem,r5_BaselineSystem,dg_BaselineSystem - Evidence: Occupied room temperature exceeds the cooling setpoint by up to 3.5-4.9 K in the 05_G36-5wk and 03_RBC-5wk baselines; the RBC baseline zones are too hot 14-19% of occupied hours with every damper pinned fully open, and in the 5-week baseline all 5 zones request cooling at once on 73% of active cycles.
- Contradicts: Sci Data descriptor (baseline = fault-free operation) (Ghalamsiah, N., Wen, J., Li, G., Chen, Y., Lu, X., Fu, Y., Chu, M. & O'Neill, Z., Labeled Datasets for Air Handling Units Operating in Faulted and Fault-free States, Sci Data 13:15, doi:10.1038/s41597-025-06179-y)
- Handling: annotate -- left as published and recorded in the provenance. Scored as fault-free as published; zone comfort and cohort rules may (correctly) flag these baselines as capacity-limited.
With the fan off the simulated air temperatures stagnate far apart
- Issue:
fan-off-stagnant-temperatures - Columns:
AHU Supply Air Temperature,AHU Mixed Air Temperature - Evidence: In the 04_G36-1wk baselines, fan-off supply minus mixed air temperature has a median of -10.4 K (cooling season) and +23.8 K (heating season) at zero flow.
- Contradicts: conventions.pdf (measured supply and mixed air temperatures) (Ghalamsiah, N., Wen, J., Li, G., Chen, Y., Lu, X., Fu, Y., Chu, M. & O'Neill, Z., Labeled Datasets for Air Handling Units Operating in Faulted and Fault-free States, Sci Data 13:15, doi:10.1038/s41597-025-06179-y)
- Handling: annotate -- left as published and recorded in the provenance. Left as published; coil and mixing rules must judge fan-on samples only. leaking_valve has done so since 0.93 (#42) when a fan status or speed is mapped, as it is here; the template still leaves it out, because it has not been re-checked on these baselines since.
at-30bldg-sensors: Austrian 30-building campus sensors (research-only)
Placeholder and clamp values sit in the raw series
- Issue:
placeholder-and-clamp-values - Columns:
value (TeVentRo, TeVentSu, TeCoolSu and other classes),value (PrVentRo) - Evidence: 150.0 appears in temperature classes (8,495 rows on 168 TeVentRo sensors, 5,247 rows on 162 TeVentSu sensors), 165.0 in 24-405 rows per class, -50 and -60 in several, and one -1.70e38 (float32 minimum) on a TeCoolSu sensor; PrVentRo is pinned at 80.0 Pa in 3,292 rows of 19 sensors. 0.0 bursts appear on 24 TeVentSu sensors (2,993 rows).
- Contradicts: README, data_anon: 'the full raw time series' of sensor readings (value: sensor reading) for temperature, humidity and pressure classes (Hadwiger, Hirsch, Kadkhoda Masoumali & Schweiger 2026, dataset README and record description (Zenodo, doi:10.5281/zenodo.20065842); paper: BuildSys '26, doi:10.1145/3744256.3812577)
- Handling: annotate -- left as published and recorded in the provenance. Left in place: they are what the sensor-health checks (range violation, trust) are meant to find. A mean-based analysis of an affected sensor is skewed.
Two sensors hold raw bit patterns, not readings
- Issue:
denormal-float-sensors - Columns:
sensor_fnnb (B06, TeCoolSu),sensor_uiyt (B06, TeCoolRe) - Evidence: sensor_fnnb has a median value of 1.7e-39 and sensor_uiyt 2.8e-40: denormal floats, consistent with integer registers decoded as float32; every other temperature sensor reads in degrees Celsius (class medians 14-49).
- Contradicts: README class table (Temp_Sensor_Cooling_Supply / _Return) (Hadwiger, Hirsch, Kadkhoda Masoumali & Schweiger 2026, dataset README and record description (Zenodo, doi:10.5281/zenodo.20065842); paper: BuildSys '26, doi:10.1145/3744256.3812577)
- Handling: annotate -- left as published and recorded in the provenance. Ingested as published; their range and trust checks fail, which is the point of a sensor-health exercise. Leave them out of any temperature statistics.
Duplicated timestamps with different values
- Issue:
duplicate-timestamps - Columns:
datetime (109 sensors) - Evidence: 39,211 duplicated timestamps across 109 sensors, every pair with two different values (one sensor alone has 12,101 in 10.0 M rows); they are not concentrated on daylight-saving dates.
- Contradicts: README, data_anon: one timestamp and value per measurement (Hadwiger, Hirsch, Kadkhoda Masoumali & Schweiger 2026, dataset README and record description (Zenodo, doi:10.5281/zenodo.20065842); paper: BuildSys '26, doi:10.1145/3744256.3812577)
- Handling: annotate -- left as published and recorded in the provenance. CAMBER keeps the first value of each duplicated stamp, as for every table it reads (the authors' own pipeline also drops them); the count is recorded per facility.
Timestamps are naive and follow no daylight saving
- Issue:
clock-is-utc-like - Columns:
datetime - Evidence: The 02:00-03:00 hour carries data on both spring-forward days (17,852 rows on 2023-03-26, 8,922 on 2024-03-31), an hour local Austrian time does not have, and the daily outdoor-temperature peak of the 76 fast OA sensors has a median of 13.7 h in both winter and summer (no one-hour shift).
- Contradicts: README, data_anon: datetime is 'the timestamp of the measurement' (no time zone stated) (Hadwiger, Hirsch, Kadkhoda Masoumali & Schweiger 2026, dataset README and record description (Zenodo, doi:10.5281/zenodo.20065842); paper: BuildSys '26, doi:10.1145/3744256.3812577)
- Handling: annotate -- left as published and recorded in the provenance. Left as published and read as a fixed-offset clock (UTC-like); hour-of-day analyses should not assume local civil time.
Every sensor is silent for two days in December 2023
- Issue:
shared-outages - Columns:
datetime (all sensors) - Evidence: All 1,832 sensors log nothing from 2023-12-06 08:00 to 2023-12-08 09:00 (2.08 days); 96.8% are silent on 2024-04-01 10:00-21:00; 18 sensors have a gap longer than 30 days (up to 57) and 4 are silent for more than half the period.
- Contradicts: Record description: 'over 23 months of continuous measurements' (Hadwiger, Hirsch, Kadkhoda Masoumali & Schweiger 2026, dataset README and record description (Zenodo, doi:10.5281/zenodo.20065842); paper: BuildSys '26, doi:10.1145/3744256.3812577)
- Handling: annotate -- left as published and recorded in the provenance. Left as gaps: the sample-and-hold resample carries a value for at most 8 h 5 min, so a longer silence stays missing.
The cooling supply/return classes mix chilled-water and warmer circuits
- Issue:
cooling-classes-mix-circuits - Columns:
value (TeCoolSu, TeCoolRe) - Evidence: TeCoolSu: the median of per-sensor medians is 14.4 C but the top decile of sensors sits at 28.6 C (p99 42 C); TeCoolRe: 20.6 C, top decile 28 C (p99 44 C). 26 of 88 TeCoolSu and 15 of 45 TeCoolRe sensors spend more than 10% of their hours outside chilled-water bounds.
- Contradicts: README class table (Temp_Sensor_Cooling_Supply / Temp_Sensor_Cooling_Return: one class per circuit role) (Hadwiger, Hirsch, Kadkhoda Masoumali & Schweiger 2026, dataset README and record description (Zenodo, doi:10.5281/zenodo.20065842); paper: BuildSys '26, doi:10.1145/3744256.3812577)
- Handling: annotate -- left as published and recorded in the provenance. Mapped as chw_supply_temp / chw_return_temp as labelled; a warm-circuit sensor reads as out of range. Check a sensor's level before treating it as chilled water.
Some room differential-pressure sensors are saturated
- Issue:
room-pressure-saturation - Columns:
value (PrVentRo) - Evidence: 7 PrVentRo sensors hold -39.6 to -39.9 Pa and one -99.7 Pa for the whole period (p99 - p01 under 0.05 Pa).
- Contradicts: README class table (DiffPressure_Sensor_Ventilation_Room) (Hadwiger, Hirsch, Kadkhoda Masoumali & Schweiger 2026, dataset README and record description (Zenodo, doi:10.5281/zenodo.20065842); paper: BuildSys '26, doi:10.1145/3744256.3812577)
- Handling: none -- described only. Described only: PrVentRo has no CAMBER role and is not ingested.
cofactor-drammen: COFACTOR Drammen (45 Norwegian public buildings, hourly energy)
Timestamps are a fixed UTC+1 clock; the buildings run on Oslo summer time
- Issue:
timestamps-fixed-utc-plus-1 - Columns:
TimeStamp (every building file) - Evidence: All 1,628,777 rows in the 45 files carry the offset +0100 and every file is one unbroken hourly grid: no missing or repeated hour at any of the eight daylight-saving switches 2018-2021. The weekday morning rise of ElImp (the hour its mean profile crosses halfway between night and day) comes 0.98 h earlier in summer-time weeks (April, September-October) than in standard-time weeks (March, October-November): median of 44 buildings, 41 of them earlier by at least 0.5 h. The global-radiation (SolGlob) daily centroid stays at 11.8-12.0 h in both seasons. So the stamps are true UTC+1 instants, never shifted for summer time, while occupancy follows Europe/Oslo clock time.
- Contradicts: Data descriptor Table 4 describes TimeStamp as 'Time stamp in local UTC time'. The Data Records section gives the zone as Etc/Gmt-1 (UTC+1) with Europe/Oslo as the actual local zone, which the data bear out. (Lien, Walnum & Sørensen 2025, Sci Data 12:393, doi:10.1038/s41597-025-04708-3)
- Handling: none -- described only. Not a correction of values: the ingest parses each stamp as an instant (source_timezone 'offset') and stores Europe/Oslo wall-clock time (local_timezone), so schedules and time-of-day analyses line up with building operation. The spring-forward hour is a gap. The autumn fall-back hour holds two readings, which the hourly resample averages into one stored hour; daily M&V counts that hour twice from the entry's zone (0.93, #68), so the day has its 25 hours of energy. Quirk timestamps below are UTC.
The spring 2020 COVID-19 school and kindergarten closures are in the data, undocumented
- Issue:
covid-19-closures-2020 - Columns:
ElImp (schools and kindergartens, from 2020-03-12) - Evidence: Mean weekday 08-15 h ElImp in 16 March-3 April 2020 compared with 18 March-5 April 2019, at a similar outdoor temperature (5.0-6.7 vs 5.0-6.0 degC): schools 0.49x the 2019 load (median of 14 buildings, range 0.35-1.03), kindergartens 0.63x (20 buildings, 0.32-0.92), nursing homes 0.98x (7 buildings, 0.87-1.06), offices 0.69x and 0.99x. Norway closed schools and kindergartens from 12 March 2020 and reopened them in stages from 20 April to 11 May 2020.
- Contradicts: Data descriptor, Background & Summary: presents the four years as continuous measurement 'capturing the effects of the weather and user behaviour'. The descriptor never mentions the 2020 pandemic closures. (Lien, Walnum & Sørensen 2025, Sci Data 12:393, doi:10.1038/s41597-025-04708-3)
- Handling: annotate -- left as published and recorded in the provenance. Left as published: a documented non-routine period, not a meter fault. The config template's M&V baseline (2018) avoids it. A reporting period that includes spring 2020, or the later 2020-2021 restrictions, needs a non-routine adjustment before any saving is claimed.
Hourly readings are quantised to 1 kWh (electricity) and 10 kWh (several heat meters)
- Issue:
meter-resolution-quantised - Columns:
ElImp (42 of 45 buildings),HtDH (6404, 6436),HtTot (6412, 6436, 6442),HtHP (6413, 6421, 6432, 6442),HtSpace (6432),heat meters of 6413 - Evidence: In 42 of the 45 buildings every ElImp reading is a whole number of kWh (a multiple of 1,000 Wh). For the 20 kindergartens, whose median hourly import is 11 kWh (3 kWh at the smallest), one step is 5-33% of a typical hour. 88.5-99.6% of the non-zero hours of the heat meters listed are multiples of 10,000 Wh, e.g. 6432 HtSpace (median 20 kWh/h) and 6442 HtTot and HtHP (20-30 kWh/h).
- Contradicts: Data descriptor, Table 6: the AMS main meters are 'assumed to have high accuracy and high metering resolution'; Methods: hourly resolution. (Lien, Walnum & Sørensen 2025, Sci Data 12:393, doi:10.1038/s41597-025-04708-3)
- Handling: annotate -- left as published and recorded in the provenance. Left as published. The hourly values of these meters step in whole register units, which is noise at hourly scale. Daily and longer aggregates, which the M&V template uses, are unaffected.
Electricity sub-meters exceed the total import in some hours
- Issue:
submeters-exceed-import - Columns:
ElImp,ElBoil,ElHP,sub-meters of 6413 - Evidence: ElImp (+ ElPV) minus the building's electricity sub-meters is negative in 1,024 hours at 6409 (down to -18 kWh), 297 at 6413 (-68 kWh), 234 at 6397 (-28 kWh), 24 at 6438 (-67 kWh), 12 at 6421 and 4 at 6399. The descriptor's Supplementary Table 1 lists the same negative 'ElRest' hours (1,024, 339, 234, 24, 12 and 4, plus 1 at 6412, with its own treatment of missing hours).
- Contradicts: Data descriptor, Tables 4 and 6: ElImp is the building's total imported electricity, and an electric boiler's own AMS meter is summed into it. (Lien, Walnum & Sørensen 2025, Sci Data 12:393, doi:10.1038/s41597-025-04708-3)
- Handling: none -- described only. Described only: the descriptor flags the same hours. Nothing is changed. A disaggregation or balance check should drop those hours.
One nursing home's heat-pump heat is 100x too large until May 2019
- Issue:
b6412-heat-pump-heat-100x - Columns:
HtHP (building_6412) - Evidence: Until 2019-05-09 03:00 (+01:00) HtHP is a median 100.0x the building's total heat HtTot (interquartile 93-108x, 11,171 hours), e.g. 7,000,000 Wh against 60,000-70,000 Wh on the morning of the change. Divided by the heat pump's electricity ElHP that implies a COP of 251. From 04:00 on the ratio is 1.00x and the COP is 2.5. The descriptor's Supplementary Table 1 sums the column to 90 GWh as a result.
- Contradicts: Data descriptor, Methods (Cleaning of the energy time series): every meter was converted to the standard unit (Wh, Table 4) (Lien, Walnum & Sørensen 2025, Sci Data 12:393, doi:10.1038/s41597-025-04708-3)
- Handling: fix -- corrected at ingest (skipped by
--no-corrections). The scaled period is masked (NaN), not rescaled: the factor of 100 is inferred, not documented. --no-corrections keeps the published values.
Register-sized spikes in one nursing home's heat meters
- Issue:
b6412-heat-register-spikes - Columns:
HtTot (building_6412),HtHP (building_6412),HtDHW (building_6412) - Evidence: HtTot reads 1,850,530,000 Wh in three hours (2021-12-15 17-19 h), HtHP 5,323,830,000 Wh in one hour (2021-12-08 11 h) and HtDHW 11,466,010 Wh in one hour (2018-07-03 03 h). Outside these hours the maxima are 230,000 Wh (HtTot), 229,690 Wh (HtHP after May 2019) and 39,840 Wh (HtDHW): factors of about 290-23,000.
- Contradicts: Data descriptor, Methods (Cleaning of the energy time series): values above a per-meter outlier threshold were removed (Lien, Walnum & Sørensen 2025, Sci Data 12:393, doi:10.1038/s41597-025-04708-3)
- Handling: fix -- corrected at ingest (skipped by
--no-corrections). The five values are masked (HtTot and HtHP above 1e8 Wh, HtDHW above 1e7 Wh). --no-corrections keeps them.
One school's meters all stop at the end of February 2020
- Issue:
b6413-meters-stop-2020-03 - Columns:
every meter of building_6413 (ElImp and 16 sub-meters) - Evidence: All 17 energy columns of building_6413, ElImp included, are empty from 2020-03-01 00:00 to the file's last row, 2021-12-31 23:00: 16,104 hours, 46% of the file. ElLight has already stopped on 2019-10-11. The timestamps and weather continue.
- Contradicts: Data descriptor, Usage Notes: 'All buildings have main meter data (ElImp) which is considered to be of high quality for the majority of the time series duration, with few missing data points'; Methods: series from 01.01.2018 to 31.12.21 / 18.03.22 (Lien, Walnum & Sørensen 2025, Sci Data 12:393, doi:10.1038/s41597-025-04708-3)
- Handling: annotate -- left as published and recorded in the provenance. Left as published: the building has 26 months of data (2018-01 to 2020-02). The 2018 M&V baseline is complete; any later period for this building has no data.
One school's total import equals its boiler meter every summer
- Issue:
b6420-import-equals-boiler-in-summer - Columns:
ElImp (building_6420),ElBoil (building_6420) - Evidence: ElImp equals ElBoil exactly in 10,987 hours: 99-100% of the hours of June-September 2018 and 2021, June-August 2020 and August 2019 (92% of July 2019). In those months ElBoil carries the school's daytime load shape, e.g. 8-17 kWh on 2018-07-02, peaking at 09-10 h. The non-boiler load of a 6,290 m2 school would then be zero.
- Contradicts: Data descriptor, Table 6: ElBoil is the electric boiler's own AMS meter, summed with the building's other AMS meters into ElImp (Lien, Walnum & Sørensen 2025, Sci Data 12:393, doi:10.1038/s41597-025-04708-3)
- Handling: annotate -- left as published and recorded in the provenance. Left as published. ElImp is plausible as the building's total. The summer ElBoil values are not a boiler load, so boiler-disaggregation work should drop those months.
One kindergarten's import is near zero from July to November 2020
- Issue:
b6428-near-zero-import-2020 - Columns:
ElImp (building_6428) - Evidence: After a 360-hour gap from 2020-03-21, ElImp is 0 in 2,486 hours of 2020 (July 605, August 543, September 568, October 452, November 291), and 1 kWh in most of the rest. Monthly imports of 143-204 kWh in August-October 2020 compare with 1,712-5,262 kWh in the same months of 2019. The metadata notes give no closure or renovation.
- Contradicts: Data descriptor, Cleaning of the energy time series (repeating zero values removed) and Usage Notes (ElImp of high quality) (Lien, Walnum & Sørensen 2025, Sci Data 12:393, doi:10.1038/s41597-025-04708-3)
- Handling: annotate -- left as published and recorded in the provenance. Left as published: it may be a vacancy or a meter fault; neither is documented. The 2018 M&V baseline is unaffected. Treat mid-2020 as non-routine for this building.
One nursing home's hot-water-heater meter reads zero for 28 months
- Issue:
b6417-hot-water-heater-meter-zero - Columns:
ElHWH (building_6417) - Evidence: ElHWH is exactly 0 for 20,655 consecutive hours, from 2019-10-16 15:00 to the file's end on 2022-02-23. Before, it averages 4.5 kWh/h. The building's DHW heat meter HtDHW keeps reading (median 3.7 kWh/h over the same period).
- Contradicts: Data descriptor, Cleaning of the energy time series: repeating zero values were removed (Lien, Walnum & Sørensen 2025, Sci Data 12:393, doi:10.1038/s41597-025-04708-3)
- Handling: annotate -- left as published and recorded in the provenance. Left as published. Treat ElHWH after 2019-10-16 as missing, not as a heater that stopped.
Global radiation exceeds the solar constant at two buildings in March 2022
- Issue:
solar-radiation-above-solar-constant - Columns:
SolGlob (building_6411, building_6441) - Evidence: SolGlob reaches 2,653 W/m2 (6411) and 2,689 W/m2 (6441) between 2022-03-14 and 2022-03-18. That is 21 and 22 hours above 1,100 W/m2, 10 and 14 of them above the 1,361 W/m2 solar constant. Every file also holds 386-446 hours of slightly negative SolGlob (down to -0.11 W/m2).
- Contradicts: Data descriptor, Table 5: SolGlob is MET Nordic global horizontal radiation (W/m2) (Lien, Walnum & Sørensen 2025, Sci Data 12:393, doi:10.1038/s41597-025-04708-3)
- Handling: none -- described only. Not ingested: CAMBER has no irradiance role, and only Tout is stored.
One school's PV metadata field reads as a clock time
- Issue:
b6397-pv-metadata-mangled - Columns:
pv (header block of building_6397) - Evidence: The pv field of building_6397 is '238:46:00', a spreadsheet time value. Table 2's format is location:kWp:kW (e.g. 'Roof:3:3'), so a size of about 238 kWp with a 46 kW inverter was probably intended; the building's ElPV peaks at 32.75 kWh/h.
- Contradicts: Data descriptor, Table 2 (pv: 'Location, size (kWp) and inverter capacity (kW)') (Lien, Walnum & Sørensen 2025, Sci Data 12:393, doi:10.1038/s41597-025-04708-3)
- Handling: none -- described only. Metadata only; CAMBER does not ingest the header block.
bts: BTS Building TimeSeries: three Australian buildings, Brick-labelled, three years
Timestamps are UTC instants, not local time
- Issue:
timestamps-are-utc - Columns:
timestamps (every series file) - Evidence: The metadata stamps end in 'Z' and the series arrays are naive datetime64; the daily outdoor-air temperature peak falls at 03-04 UTC and the trough at 19 UTC at all three sites (13-15 h and 05-06 h local), so the clock is UTC and was not shifted when the identifiers were anonymised.
- Contradicts: Data card, Data Fields: t is a 'Numpy array of Timestamp' (no time zone stated) (Prabowo et al. 2024, BTS data card and README (github.com/cruiseresearchgroup/DIEF_BTS at commit ad1f0d4); paper: NeurIPS 2024 Datasets and Benchmarks, doi:10.48550/arXiv.2406.08990)
- Handling: annotate -- left as published and recorded in the provenance. Declared per site as source_timezone UTC and moved to the site's wall clock (A and B Australia/Sydney, C Australia/Melbourne); a DST fall-back hour keeps both readings.
No unit on any HVAC point
- Issue:
units-undocumented - Columns:
value (temperature, pressure, flow and humidity points) - Evidence: The Brick models carry hasUnit on 1,798 (A), 121 (B) and 1,230 (C) points, all electrical (kW, V, A, kVA, kWh, Hz) or PERCENT/DEG; none on a temperature, pressure or flow point. Levels: zone temperatures have a median of 22.2 C (A), supply static pressures 319 Pa and their setpoints 270-315 Pa (A), filter pressure drops 42-213 Pa (A).
- Contradicts: Data card, Data Fields: v is a 'Numpy array of Float', 'Field Value' (no unit) (Prabowo et al. 2024, BTS data card and README (github.com/cruiseresearchgroup/DIEF_BTS at commit ad1f0d4); paper: NeurIPS 2024 Datasets and Benchmarks, doi:10.48550/arXiv.2406.08990)
- Handling: annotate -- left as published and recorded in the provenance. CAMBER declares degC for temperatures, Pa for duct static and filter pressure, kPa for chilled-water differential pressure and L/s for air and water flows, from these levels, and converts to IP; the flows and site C's pressures are the least certain (see the other issues and the ingest warnings).
Streams listed with samples have no series file
- Issue:
streams-without-series - Columns:
StreamID (Site_B_metadata.csv, Site_A_metadata.csv) - Evidence: The data card counts 14,547 timeseries; the three archives hold 14,422 series files. The 125 missing are site B's 121 streams (listed with 17,321,764 samples in the metadata count column, mostly Point, Mode_Command, Temperature_Parameter and Reset_Command) and site A's 4 streams the README names as intentionally missing. A further 25 (A) and 5,093 of 10,440 (C) listed streams have a count of 0 and no file.
- Contradicts: Data card, Summary statistics: Number of Timeseries 14 547; metadata files: count per StreamID (Prabowo et al. 2024, BTS data card and README (github.com/cruiseresearchgroup/DIEF_BTS at commit ad1f0d4); paper: NeurIPS 2024 Datasets and Benchmarks, doi:10.48550/arXiv.2406.08990)
- Handling: annotate -- left as published and recorded in the provenance. Counted on each facility (streams_without_file, mapped_without_file); nothing is ingested for them.
Site C's series run outside the documented period
- Issue:
site-c-outside-documented-period - Columns:
timestamps (site C) - Evidence: 427 of the 455 mapped site C streams with a file have samples before 2021-01-01 (from May 2020; the metadata first_t goes back to 2017-06-23 on 4,792 rows) and 440 have samples after 2023-12-31 (to 2024-01-18); sites A and B stay within 2021-2023.
- Contradicts: Data card, Summary statistics: Start Date 01-01-2021, three-year period (Prabowo et al. 2024, BTS data card and README (github.com/cruiseresearchgroup/DIEF_BTS at commit ad1f0d4); paper: NeurIPS 2024 Datasets and Benchmarks, doi:10.48550/arXiv.2406.08990)
- Handling: annotate -- left as published and recorded in the provenance. Ingested as published; clip site C to 2021-2023 to compare the three sites over one period.
Every stream of a site is silent for weeks at a time
- Issue:
shared-outages - Columns:
timestamps (all streams of site B; site A, site C) - Evidence: Site B: fewer than 5% of streams log anything on 2021-05-14/15, 2023-06-30 to 07-07, 2023-07-10 to 08-13 (35 days), 2023-10-10 to 10-16 and 2023-10-25 to 11-19 (26 days): 78 days. Site A: one day (2022-03-09). Site C: 2021-02-23 to 25 and 2021-08-31, plus 38 days on which only 5-50% of streams log.
- Contradicts: Data card, Summary statistics: Duration 1 112 days, over a three-year period (Prabowo et al. 2024, BTS data card and README (github.com/cruiseresearchgroup/DIEF_BTS at commit ad1f0d4); paper: NeurIPS 2024 Datasets and Benchmarks, doi:10.48550/arXiv.2406.08990)
- Handling: annotate -- left as published and recorded in the provenance. Left as gaps: the sample-and-hold resample carries a value for at most 1 hour.
Site C's temperatures, humidities and CO2 drop to exactly 0
- Issue:
site-c-zero-dropouts - Columns:
value (site C temperature, humidity and CO2 streams) - Evidence: 12.5% of all samples of site C's mapped temperature streams are exactly 0.0; 229 of its 230 temperature streams have more than 1% zeros; the zeros come one sample at a time (median run 1 sample, 449,068 runs) between normal readings, and on 115 days more than half the temperature streams read 0. Site A has 0.6% (two dead streams), site B none (every temperature stream's 5th percentile is above 7 C). CO2 and humidity streams at site C have a 5th percentile of exactly 0 as well.
- Contradicts: Data card, Data Fields: v is the 'Field Value' of the point (Prabowo et al. 2024, BTS data card and README (github.com/cruiseresearchgroup/DIEF_BTS at commit ad1f0d4); paper: NeurIPS 2024 Datasets and Benchmarks, doi:10.48550/arXiv.2406.08990)
- Handling: fix -- corrected at ingest (skipped by
--no-corrections). Masked to missing at ingest for site C only (quirk mask eq 0), before the 15-minute resample; --no-corrections keeps them.
Placeholder and overflow values in some streams
- Issue:
sentinel-and-overflow-values - Columns:
value (site A hot-water flow; site C outdoor air, chilled-water return, supply-air setpoint) - Evidence: Site A's 4 hot-water flow streams sit at 4,294,967.3 (2^32 / 1000) or 1,193,046.5 (2^32 / 3600): an unsigned 32-bit -1 scaled, not a flow. Site C: one outdoor-air stream reads 2000 for 35% of its samples (another 1105.8), a chilled-water return 137,300, a supply-air setpoint 500 for 38% of its samples. Site A's 6 outdoor CO2 streams are 0.0 throughout.
- Contradicts: Data card, Data Fields: v is the 'Field Value' of the point (Prabowo et al. 2024, BTS data card and README (github.com/cruiseresearchgroup/DIEF_BTS at commit ad1f0d4); paper: NeurIPS 2024 Datasets and Benchmarks, doi:10.48550/arXiv.2406.08990)
- Handling: annotate -- left as published and recorded in the provenance. Left in place for the sensor-health checks (range violation, trust); leave these streams out of statistics.
Site C's airflows are mostly negative and its duct static pressures mix scales
- Issue:
site-c-airflow-sign-and-scale - Columns:
value (site C Discharge_Air_Flow_Sensor, Discharge_Air_Flow_Setpoint, Supply_Air_Static_Pressure_Sensor) - Evidence: 45 of 58 discharge airflow streams have a negative 5th percentile, 19 a negative median and 23 never rise above 0; 37 of 38 airflow setpoints hold -50 throughout. Of 18 supply static pressure streams, 14 stay below 30 at their 95th percentile and 4 reach 190-292, the level of site C's own static pressure setpoints (190-290) and of site A's sensors in Pa.
- Contradicts: Brick v1.2.1 Discharge_Air_Flow_Sensor / Supply_Air_Static_Pressure_Sensor (a flow and a positive duct pressure) (Prabowo et al. 2024, BTS data card and README (github.com/cruiseresearchgroup/DIEF_BTS at commit ad1f0d4); paper: NeurIPS 2024 Datasets and Benchmarks, doi:10.48550/arXiv.2406.08990)
- Handling: annotate -- left as published and recorded in the provenance. Ingested as published (L/s and Pa declared for the entry); the airflow rules and ingest warnings flag them. Do not compare site C's airflows or static pressures with sites A and B.
Some site C points keep a second, non-anonymised stream id
- Issue:
non-anonymised-stream-ids - Columns:
senaps:stream_id (Site_C.ttl) - Evidence: 136 of site C's points carry two stream-id literals: the UUID the metadata lists and a second one that is a BMS object path rather than a UUID; sites A and B have one UUID per point.
- Contradicts: Data card, Collection: identifiers for both the point and the timeseries were anonymised by generating UUIDs (Prabowo et al. 2024, BTS data card and README (github.com/cruiseresearchgroup/DIEF_BTS at commit ad1f0d4); paper: NeurIPS 2024 Datasets and Benchmarks, doi:10.48550/arXiv.2406.08990)
- Handling: none -- described only. CAMBER matches points only through the ids the metadata index lists; the second literal is never read into a store or a report.
synthetic-hw-plant-lockout: Synthetic hot-water plant: warm-weather lockout (generated by CAMBER)
Synthetic: CAMBER generates this dataset (see synthetic datasets), so there is no published data to have issues.
Where files go
Downloads and extracted members live in the cache: $CAMBER_DATA_DIR, else
$XDG_CACHE_HOME/camber/datasets, else ~/.cache/camber/datasets (override per command with
--dir). camber datasets status shows what is fetched and how much disk it uses;
camber datasets remove <id> deletes it (--purge-store also drops its facilities from a store).
Dropped facility ids are tombstoned and so never reused for another building; re-ingesting the
same dataset reclaims its own id (see PORTFOLIO.md).
See SECURITY.md section 7 for the download guarantees.
Pre-release catalog check (maintainers)
Before a release that changes the catalog, run every entry end to end on local data:
python scripts/catalog_sweep.py --out /scratch/sweep --local-root examples/_data --run-benchmarks
python scripts/catalog_sweep.py --out /scratch/sweep --skip-done           # resume after a stop
python scripts/catalog_sweep.py --out /scratch/sweep2 ... --compare /scratch/sweep/summary.json
For each entry (the full subset by default; --subset default for a quick pass) it seeds the
cache from the local copies (hard links, matched by size and name) and verifies them through the
real fetch path with the network refused (--download-missing allows it for files with no local
copy); ingests into one store inside a portfolio workspace and re-ingests to prove the skip on an
unchanged content hash; runs each config template with camber run (and camber drift run when a
template has a drift section); scores labelled entries, including a re-score on the LBNL
benchmark's scenario set against examples/lbnl_fdd/benchmark-baseline.json; lists every rule
that trips on a fault-free scenario; builds the RCx and audit reports for one fault-free and one
faulted equipment and checks their licence block and that no G36 verdict appears without a
sequence (a citation -- an action plan's Cite column, an ECM Standard -- is not a verdict);
and runs the BDG2 M&V baseline over every site against
examples/bdg2/benchmark-baseline.json. It writes summary.json and summary.md, stops before
free disk would drop below --min-free-gb (40 GB), and is resumable per dataset (--only,
--skip-done). Manual entries are verified from the seeded copies the way ingest --from-dir
does, and research-only entries are swept only with --accept-noncommercial. --skip-rcx
at-30bldg-sensors builds only the audit report for the named entries: the RCx report's
representative-week search is slow on long runs (one 23-month sensor takes many minutes; #35),
and the skip is recorded in the summary. It is dev tooling,
not part of the package and not run in CI (it needs the full local data, tens of GB).
Link check (maintainers)
scripts/datasets_linkcheck.py asks every publisher whether it still serves each catalog file at
its pinned size and ETag (HEAD, falling back to a one-byte ranged GET), and -- where an entry
sets licence_check ({"url": ..., "expect": "CC BY 4.0", "json_path": "license.name"}) --
whether the licence page still states the recorded licence. The datasets-linkcheck workflow runs
it weekly (and on demand) and writes the report to the job summary with a warning per drift; it
never fails the build, because fetch already refuses any file that differs from its pin. On
drift, re-verify the entry (scripts/datasets_refresh.py <id>) and re-check its licence on the
host's own page before re-pinning. pytest -m network runs the one test that downloads a real
(small) file end to end.