Cooling tower: approach, fan effort and a leaking tower bypass
Workbook exercise plant-cooling-tower · PNNL re-tuning chapter 8 · about 40 minutes
Goal
Judge a cooling tower the way its controller sees it. A tower that holds its leaving water at a setpoint hides fouling in its fan: the approach barely moves while the fan works harder. Find that effort in CAMBER's findings, check the condenser-water reset, and find a tower bypass valve that lets water skip the tower while it is commanded shut.
Learn more
Read these first (PNNL, free):
- Central Utility Plant Cooling Control, the re-tuning guide, for the water-cooled plant this tower serves and the points worth trending.
- Chapter 8: Central Utility Plant of the re-tuning training, for the central plant as a whole, towers included.
Datasets and licence
lbnl-chiller: LBNL's simulated water-side chiller plant (three chillers, three cooling towers, primary and secondary chilled-water loops), a year at one-minute resolution, as a fault-free run plus labelled faulted runs. Licence CC-BY-4.0 (open; cite it). The download is about 1.6 GB; this exercise ingests thefullsubset (all 24 runs). The catalog lists the problems found in the published data and how CAMBER handles each, among them the swapped outdoor dry-bulb and wet-bulb columns that CAMBER fixes at ingest: see its data issues.
Each run becomes PLANT__<run> in the facility ds-lbnl-chiller; tower 1 is the mapped tower.
This exercise reads PLANT__fault_free, the three tower-fouling runs
(PLANT__coolingtower_fouling_065, the most severe, _080 and _095), the tower controller's
PI mistuning (PLANT__coolingtower_PI) and the five tower-bypass runs
(PLANT__bypass_leakage_025 ... PLANT__bypass_stuck_075).
Setup
In the lab
- Run
camber laband open the URL it prints (http://127.0.0.1:8765/lab?token=...). - Choose the full subset, tick
lbnl-chillerand press Fetch & ingest. - When the job is done, the row links to trends (the trend viewer). This exercise uses its own config: use the command line for step 2 of the steps below.
On the command line
camber datasets fetch lbnl-chiller
camber datasets ingest lbnl-chiller --subset full --store lab_store
camber datasets config lbnl-chiller --exercise plant-cooling-tower --store lab_store --out tower.json
camber run tower.json --out tower_out
camber datasets score lbnl-chiller --store lab_store --findings tower_out/findings.json
The exercise's config (--exercise plant-cooling-tower) runs three rules:
cooling_tower_approach, with the design approach the dataset template calibrates from the
fault-free run, judged only when the tower fan runs at 90 % or more; condenser_water_reset; and
condenser_bypass_leak, which compares the water entering the chillers with the water leaving
the tower while the bypass valve is commanded shut. Its drift section adds the tower drift
family with a declared reference: cooling_tower_fan_effort_drift scores every run's fan
effort against PLANT__fault_free, fitted in memory on each run and never stored.
Steps
- Look before you judge. In the trend viewer, open
PLANT__fault_freeandPLANT__coolingtower_fouling_065. Plot the tower's leaving water, the wet-bulb and the tower fan speed over a hot week. What does the controller hold constant, and what changes? - Run the exercise's config (the commands above) and read the findings
camber runprints. - Approach. In
tower_out/findings.json, comparecooling_tower_approachfor the fault-free and the 65 % fouled tower:approach_median_f,pct_hours_high_approachandn_operating(the hours the rule judged: fan at 90 % or more). - Reset. Read
condenser_water_resetfor the fault-free run:cws_slope_per_wetbulb. - Bypass. Read
condenser_bypass_leakfor the bypass runs and for the fault-free run, and read whatcooling_tower_approachsays about the bypass runs. - Fan effort against a reference. Read
cooling_tower_fan_effort_driftfor the three tower-fouling runs, the fault-free run and the tower-sensor-bias runs (PLANT__coolingtower_bias_1,_2):fan_effort_drift_pct,attributionand the summary. Then runcamber datasets scoreand read the rates forcooling_tower_approachandcooling_tower_fan_effort_drift.
Questions
- What approach does the healthy tower achieve at high fan, and what does CAMBER say about it?
- Is the 65 % fouled tower flagged? How far does its approach move, and in how many more of its judged hours is the approach high?
- Where does the fouling show instead? Compare how many hours each tower spends at high fan.
- Does the condenser-water supply follow the wet-bulb? What slope does CAMBER find?
- What does
condenser_bypass_leakfind on the stuck bypass, and why can the approach rule not judge the bypass runs at all? - What does the label score give
cooling_tower_approach? What doescooling_tower_fan_effort_driftmeasure instead, which foulings does it catch against the reference, and what does it say about the fault-free run and the tower-sensor biases?
What CAMBER shows
- Findings.
camber runprints one line per finding with its severity.findings.jsonholds the metrics:approach_median_f,pct_hours_high_approach(hours more than 3 °F above the design approach),n_operatingandn_low_effort_excludedforcooling_tower_approach;cws_slope_per_wetbulbandreset_presentforcondenser_water_reset;median_diff_f,bypass_fraction_estandattributionforcondenser_bypass_leak;fan_effort_drift_pct(fan %-points at matched condenser range and wet-bulb),sensor_offset_shift_f,attributionandbaseline_sourceforcooling_tower_fan_effort_drift. - Declines. A rule that cannot judge says why in its summary (an
infofinding): for example a tower fan that never reached the effort gate. The declared reference itself declines asis_reference: it is the yardstick, not a result. - Score.
camber datasets scoreprints the true- and false-positive rates, with 95 % intervals, for the dataset's declared detectors.
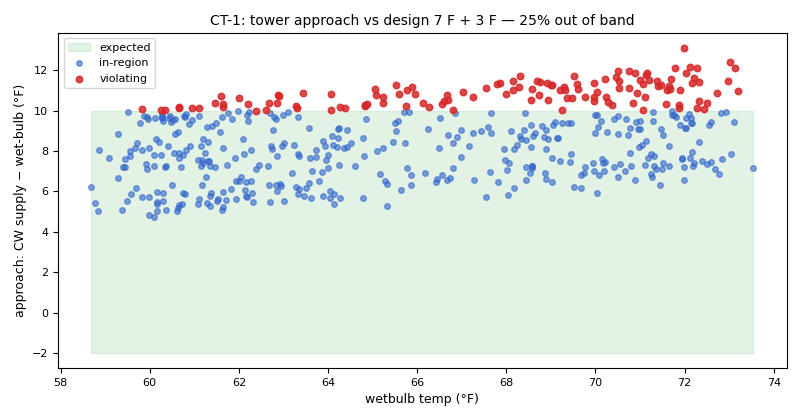
Synthetic illustration, not this exercise's dataset: the cooling_tower_approach evidence chart. Tower approach (condenser-water supply minus wet-bulb) against wet-bulb, over the samples the rule judged, with a band up to the design approach plus 3 °F. The red points are the samples pct_hours_high_approach counts. The approach grows week by week.
Caveats
- The data are simulated. The simulated tower's design approach is not published, so the config's ceiling is the fault-free run's own median at high fan: a calibration, not a design value.
- The tower holds its leaving water at the wet-bulb plus a fixed offset, with a 60 °F floor. In cool weather the approach is the controller's choice, which is why the rule judges only hours at high fan.
- The simulated bypass runs drive the condenser loop far hotter than a real chiller would tolerate before tripping, and in both 75 % runs the valve command reads zero all year. Read the size of the difference as a simulation artefact; the direction is what matters.
- The bypass runs' estimated bypassed fraction does not follow the severities in their file names; do not read it as the leak size. The two 75 % runs (leaking and stuck) are the same data, so they are one case counted twice. The catalog records all of this as a data issue.
Going further
- Here the fan-effort rule compares each run with another tower (the fault-free run), because
each fault is its own year-long run. On a real plant, compare a tower with itself: declare a
known-good period as the reference (
"reference": {"period": [start, end]}), or freeze a baseline after commissioning withcamber drift freezeand compare each season with it (see the CLI guide). - Try
design_approach_flower intower.json: at what value is the fouled tower flagged, and what else is flagged with it? - Compare the tower-sensor-bias runs (
PLANT__coolingtower_bias_2...) with the fouled tower in the sensor exercise.