Energy charting: load profiles, base load and weather dependence
Workbook exercise data-energy-charting · PNNL re-tuning chapter 4 · about 45 minutes
Goal
Read whole-building meters the way a re-tuning engineer does before touching a controller: weekday against weekend, night and weekend base load against the working day, the flatness of the load, and how much of it the weather explains. Four meters at one campus and two university buildings in Spain make the contrasts: a building that follows its schedule, one that never sets back, one that should not set back, and a cooling load that tracks the weather.
Learn more
Read these first (PNNL, free):
- Chapter 4: Trend Data Collection and Analysis of the re-tuning training: the whole-building charts and metrics this exercise builds.
- Occupancy Scheduling, the re-tuning guide on night and weekend setback: what a meter that never drops at night is telling you.
Datasets and licence
bdg2: the Building Data Genome 2, hourly whole-building meters from campuses, 2016-2017. Licence CC-BY-SA-4.0 (open; cite it; an adaptation you redistribute keeps the licence). The default subset is about 270 MB. See its data issues.valladolid-uva: two university buildings in Valladolid, Spain, hourly electricity 2016-2020, with the publisher's daily temperature. Licence CC-BY-4.0 (open; cite it). About 6 MB. See its data issues.
The meters used: at the BDG2 site Fox (facility ds-bdg2-fox), the lodging building's
electricity and chilled water (Fox_lodging_Stephen__electricity,
Fox_lodging_Stephen__chilledwater) and an assembly building's electricity
(Fox_assembly_Audrey__electricity); in Valladolid (facility ds-valladolid-uva), UVA_A
(the Faculty of Science) and UVA_B (the Faculty of Economics). All figures are for calendar
2016.
Setup
In the lab
- Run
camber laband open the URL it prints (http://127.0.0.1:8765/lab?token=...). - Tick
bdg2andvalladolid-uvaand press Fetch & ingest. - Open trends for each meter: zoom to a week in March, then to a whole year.
On the command line
camber datasets fetch bdg2
camber datasets fetch valladolid-uva
camber datasets ingest bdg2 valladolid-uva --store lab_store
camber datasets config bdg2 --facility ds-bdg2-fox --store lab_store --out fox.json
camber run fox.json --out fox_out
camber datasets config valladolid-uva --store lab_store --out uva.json
camber run uva.json --out uva_out
Both configs are the datasets' own templates: a daily change-point baseline (energy against the day's mean outdoor temperature) for every meter over 2016, judged against the G14 acceptance tiers. That is this exercise's weather-dependence chart in numbers. The load-shape metrics come from CAMBER's Python API, on the same store:
from camber.demand import analyze_demand, baseload_anomaly
from camber.loadprofile import weekday_weekend_profiles
from camber.model.roles import Role
from camber.store import ParquetStore

store = ParquetStore("lab_store")
kw = store.read_role_frame(facility_id="ds-valladolid-uva", equip="UVA_A")[Role.POWER]
kw = kw.loc["2016"]
weekday, weekend = weekday_weekend_profiles(kw)  # mean load by hour of day
print(weekend.max() / weekday.max())
print(baseload_anomaly(kw).summary)  # out-of-hours vs weekday 07-18 load
d = analyze_demand(kw)
print(d.load_factor, d.baseload_frac)  # mean / peak, 5th percentile / peak
Swap the facility and equipment ids for the other meters (Fox is ds-bdg2-fox).
Steps
- Look first. In the trend viewer, put one March week of
UVA_Abeside the same week ofFox_assembly_Audrey__electricity. Say what you expect each metric below to show before you compute it. - Weekday against weekend. Run
weekday_weekend_profilesonUVA_A,UVA_BandFox_assembly_Audrey__electricity; compare the weekend peak with the weekday peak. - Night and weekend base load. Run
baseload_anomalyon the four electricity meters: it compares the load outside weekday 07:00-18:00 with the load inside it. - Load shape. Run
analyze_demandonFox_lodging_Stephen__electricityandUVA_B: the load factor (mean over peak) and the base-to-peak ratio (5th percentile over peak). - Weather dependence. Read the
mv_baselinefindings infox_out/findings.jsonanduva_out/findings.json: the model form (2P,3PC,3PH,4P), R² and CV(RMSE), and whether the baseline meets the G14 tier.
Questions
- Which buildings drop at weekends, and by how much does
UVA_A's weekend peak fall short of its weekday peak? Which building does not drop? - Which meters does
baseload_anomalycall a fault, and at what out-of-hours ratio? For which of them is a ratio near 1 the right answer, and why? - Which building has the flatter load, the lodging or
UVA_B? Give both load factors. - What change-point model does the lodging's chilled-water baseline choose, and how much of the daily variation does the weather explain? Compare the same building's electricity.
UVA_A's all-days daily baseline explains very little and fails G14. What does its load profile tell you is missing from a temperature-only model?
What CAMBER shows
mv_baselinefindings (camber run): the model form,r2,cv_rmse,nmbe,acceptand the temperature range the model is fitted on, per meter.weekday_weekend_profiles: two 24-value hour-of-day profiles.baseload_anomaly: occupied and unoccupied means, their ratio, and a severity (warnat 0.6,faultat 0.8: CAMBER's thresholds, not a standard's).analyze_demand: peak, average, load factor, 5th-percentile base load and its share of the peak, and the monthly peaks.- Charts of the same views:
camber.charts.loadprofile_chart(weekday and weekend profiles, load-duration curve), see Visualization.
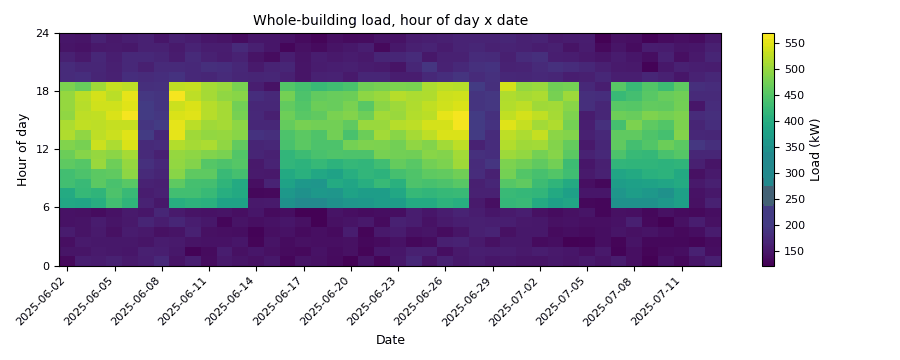
Synthetic illustration, not this exercise's dataset: a load carpet, hour of day against date. Each weekday shows the occupied block; the one weekend that runs a weekday schedule stands out at once.
Caveats
- The occupied window is a default (weekdays 07:00-18:00); a lodging building has no unoccupied hours, so its "fault" is the metric's, not the building's.
- The Fox meters are from a US campus in the BDG2 set; building use comes from the published names only. Check a meter's data issues before trusting its clock.
- A daily change-point model on all days mixes working days, weekends and holidays in one cloud;
the
mv-baselinesexercise adds an occupied-day driver. - The Valladolid temperature is the publisher's daily reanalysis value, not a site sensor.
Going further
- Plot
load_duration_chartfor the lodging and forUVA_Band read where their base loads sit. - Run
camber datasets config bdg2 --facility ds-bdg2-robin ...and repeat questions 2 and 4 on another site. - Continue with
mv-baselines, where an occupied-day driver and chaining turn these baselines into savings.