Boiler plant: what an enable point hides, pumping and a fouling gap
Workbook exercise plant-boiler · PNNL re-tuning chapter 8 · about 40 minutes
Goal
Ask the heating plant's re-tuning questions (is the hot-water supply temperature reset, are the boilers shut down in summer, do they short-cycle, is the loop DP setpoint reset?) of a simulated boiler plant, and find out how CAMBER answers them on a plant with no boiler run status. Then see what a fouled boiler and a lying DP sensor look like to the rules that do run.
Learn more
Read these first (PNNL, free):
- Central Utility Plant Heating Control, the re-tuning guide: its questions (a reset on the hot-water supply temperature, a low loop delta-T, a constant loop DP setpoint) and its advice to shut comfort-only boilers down in summer are what this exercise asks of the plant.
- Chapter 8: Central Utility Plant of the re-tuning training.
Datasets and licence
lbnl-boiler: LBNL's simulated hot-water plant (two boilers, two pumps, one loop), a year at one-minute resolution, as a fault-free run plus labelled faulted runs, with the plant's Brick model. Licence CC-BY-4.0 (open; cite it). The download is about 320 MB; this exercise ingests thefullsubset (all 17 runs). The catalog lists the problems found in the published data and how CAMBER handles each, among them the boiler status point that is really an enable: see its data issues.
Each run becomes PLANT__<run> in the facility ds-lbnl-boiler; boiler 1 and pump 1 are the
mapped units. This exercise reads PLANT__fault_free, the three boiler-fouling runs
(PLANT__boiler_foul_065, the most severe, _080 and _095), the loop DP sensor biases
(PLANT__hot_water_pressure_bias_20 ... PLANT__hot_water_pressure_bias_m20) and, for the
score, every other run.
Setup
In the lab
- Run
camber laband open the URL it prints (http://127.0.0.1:8765/lab?token=...). - Choose the full subset, tick
lbnl-boilerand press Fetch & ingest. - When the job is done, the row links to trends (the trend viewer). This exercise uses its own config: use the command line for step 2 of the steps below.
On the command line
camber datasets fetch lbnl-boiler
camber datasets ingest lbnl-boiler --subset full --store lab_store
camber datasets config lbnl-boiler --exercise plant-boiler --store lab_store --out boil.json
camber run boil.json --out boil_out
camber datasets score lbnl-boiler --store lab_store --findings boil_out/findings.json
The exercise's config (--exercise plant-boiler) lists four rules: hw_pump_dp_reset (the
dataset template's one rule), boiler_summer_lockout, boiler_short_cycle and
hw_plant_deltat, all with their defaults. Read its _comment: the last three need to know when
the boiler fired, and this plant has no boiler run status.
Its drift section adds the boiler drift family with a declared reference:
boiler_efficiency_drift scores every run's gas input per unit of heat delivered against
PLANT__fault_free, fitted in memory on each run and never stored.
Steps
- Look before you judge. In the trend viewer, open
PLANT__fault_freeand plot the loop supply and return temperatures with the outdoor temperature over the whole year. Then plot boiler 1's gas input. - Run the exercise's config (the commands above). Count the findings per rule.
- Firing without a run status. Read the dataset's data issues and known issues on the
boiler status point (
camber datasets info lbnl-boilerprints them). Then read therun_sourcemetric and the caveats of theboiler_summer_lockout,boiler_short_cycleandhw_plant_deltatfindings for the fault-free run. - Pumping. Read
hw_pump_dp_resetfor the fault-free run inboil_out/findings.json:median_speed_pct,pct_running_near_full,pct_running_near_min,dp_sp_reset_presentandn_running. - Fouling. Find every finding on
PLANT__boiler_foul_065, and compare its gas input with the fault-free run's in the trend viewer. Then readboiler_efficiency_driftfor the three boiler-fouling runs and the two hot-water temperature biases (PLANT__hot_water_temp_bias_2,_4):ratio_drift_rel,gas_rise_at_matched_oat,attributionand the summary. - The DP sensor. Compare
median_speed_pctfor the two ±20 % loop DP sensor biases with the fault-free run's, and plot the loop DP against its setpoint for one of them. - Score. Run
camber datasets scoreand read the rates forboiler_efficiency_drift.
Questions
- The config lists four rules. Which produce findings? How do the three that need a boiler run status decide when the boiler fired, and what can that not see?
- Is the hot-water supply temperature reset, and is the boiler shut down in summer? What does CAMBER say about each on this plant, and what does the trend viewer show you?
- What does
hw_pump_dp_resetfind on the fault-free plant, and what does itsokleave out? - Does any point-in-time rule see the worst boiler fouling? Where does it show? What does
boiler_efficiency_drift, scored against the declared reference, find on the three foulings and on the hot-water temperature biases? - What does a loop DP sensor that reads 20 % high or low do to the pump, and to the DP reading
itself? What does the label score say for
boiler_efficiency_drift?
What CAMBER shows
- Findings.
camber runprints one line per finding. A rule whose required points are not mapped does not run on that equipment, and prints nothing: no finding is not the same asok. - Firing.
boiler_summer_lockout,boiler_short_cycleandhw_plant_deltatread when the boiler fired from its run status (boiler_status) or, when none is mapped, from its gas input (gas_input_rate) above 5 % of its own 95th percentile. A finding read from the gas input carriesrun_sourcegasand a caveat saying so. - Metrics. For
hw_pump_dp_reset: the median speed, the shares near full (90 % or more) and near minimum (25 % or less), the median DP setpoint, whether it is reset, andn_running(the hours the pump ran). - Drift.
boiler_efficiency_driftreportsratio_drift_rel(the change in gas input per unit of heat delivered, as a fraction),gas_rise_at_matched_oat,attributionandbaseline_source. The declared reference itself declines asis_reference: it is the yardstick, not a result. - Score.
camber datasets scoreprints the true- and false-positive rates, with 95 % intervals, for the entry's one declared detector,boiler_efficiency_drift(target: boiler fouling).
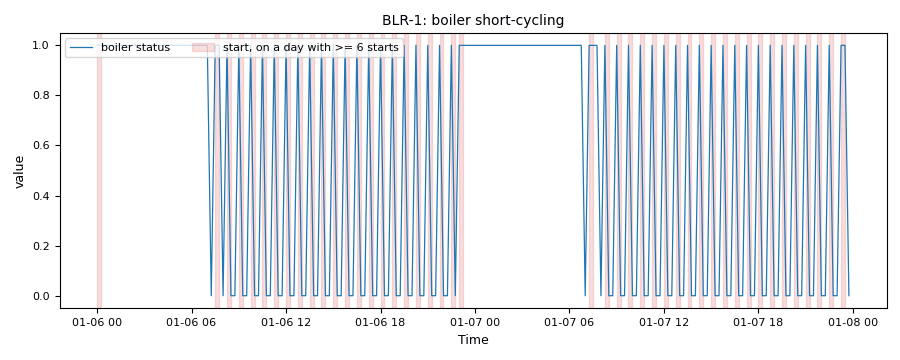
Synthetic illustration, not this exercise's dataset: the boiler_short_cycle evidence trend of the boiler's run status: 15 minutes on, 30 off, through every mild hour. Each shaded interval is a start the rule counts on a day with at least max_starts_per_day of them.
Caveats
- The data are simulated: one plant, one climate, one control sequence.
- The plant's boiler status is an enable, on all year; mapping it as a run status would make every idle hour look like firing, so CAMBER leaves it unmapped and the firing rules read the gas input instead. On the hourly trend a firing shorter than an hour is invisible, so the start count is a floor. On a real plant, trend the burner's firing signal.
- The plant exports no hot-water supply setpoint, so no rule compares the supply with it.
hw_pump_dp_resetreads pump 1 only; pump 2 is not mapped.- The
hot_water_temp_biasruns bias the loop return, not the supply as documented (see the data issues).
Going further
- Here
boiler_efficiency_driftcompares each run with another boiler (the fault-free run), because each fault is its own year-long run. On a real plant, compare a boiler with itself: declare a clean season as the reference ("reference": {"period": [start, end]}), or freeze a baseline withcamber drift freezeand compare later seasons with it (see the CLI guide). - Compare this plant with the chilled-water side: the same three questions, answered from different points.
- See the sensor exercise for why a sensor bias is scored as a negative.
- This plant's boiler always passes
boiler_summer_lockout. See the lockout exercise for a boiler, and a pump, left on in warm weather, on a synthetic plant.