Chiller efficiency: calibrating a design ceiling, and chiller fouling
Workbook exercise plant-chiller-efficiency · PNNL re-tuning chapter 8 · about 45 minutes
Goal
Judge a chiller's kW/ton against a ceiling that fits this chiller. First see what a generic ceiling does to a healthy plant. Then calibrate the ceiling from the plant's own fault-free run and find the runs that really cost energy: a fouled chiller and a leaking tower bypass. Finally, score the rule against the dataset's published labels.
Learn more
Read these first (PNNL, free):
- Central Utility Plant Cooling Control, the re-tuning guide, for how a water-cooled plant is controlled and which points to trend. It judges the plant by its controls (reset, delta-T, pumping; see the reset and pumping exercise) rather than by kW/ton, which is what this exercise adds.
- Chapter 8: Central Utility Plant of the re-tuning training, for the central plant as a whole.
Datasets and licence
lbnl-chiller: LBNL's simulated water-side chiller plant (three chillers, three cooling towers, primary and secondary chilled-water loops), a year at one-minute resolution, as a fault-free run plus labelled faulted runs. Licence CC-BY-4.0 (open; cite it). The download is about 1.6 GB; this exercise ingests thefullsubset (all 24 runs). The catalog lists the problems found in the published data and how CAMBER handles each: see its data issues.
Each run becomes one piece of equipment, PLANT__<run>, in the facility ds-lbnl-chiller
(chiller 1 and tower 1 are the mapped units). This exercise reads PLANT__fault_free, the two
chiller-fouling runs (PLANT__chiller_fouling_065, the severe one, and
PLANT__chiller_fouling_095), the tower-fouling runs (PLANT__coolingtower_fouling_065 ...),
the tower-bypass runs (PLANT__bypass_leakage_025 ... PLANT__bypass_stuck_075) and, for the
score, every other run.
Setup
In the lab
- Run
camber laband open the URL it prints (http://127.0.0.1:8765/lab?token=...). - Choose the full subset, tick
lbnl-chillerand press Fetch & ingest. - When the job is done, the row links to trends (the trend viewer) and report (the dataset's default config, which is this exercise's second run). The first run uses its own config: use the command line for it.
On the command line
camber datasets fetch lbnl-chiller
camber datasets ingest lbnl-chiller --subset full --store lab_store
camber datasets config lbnl-chiller --exercise plant-chiller-efficiency--generic --store lab_store --out generic.json
camber run generic.json --out generic_out
camber datasets score lbnl-chiller --store lab_store --findings generic_out/findings.json
camber datasets config lbnl-chiller --store lab_store --out chiller.json
camber run chiller.json --out chiller_out
camber datasets score lbnl-chiller --store lab_store --findings chiller_out/findings.json
The first config (--exercise plant-chiller-efficiency--generic) runs chiller_efficiency with
the rule's own generic ceiling of 0.85 kW/ton. The second is the dataset's default config: the
same rule with a ceiling calibrated from the fault-free run (its value is in the config),
because the simulated chiller's design curve is not published, plus cooling_tower_approach (the subject of
the cooling-tower exercise). Read the _comment in each config file.
Steps
- Look before you judge. In the trend viewer, open
PLANT__fault_freeand plot the chiller power with the chilled-water supply and return temperatures over a summer week. When is the chiller loaded, and when does it idle? - Run the generic config and read what
camber runprints forPLANT__fault_free. Score it withcamber datasets score. - Run the calibrated config and read
chiller_efficiencyfor the fault-free run again. - Chiller fouling. Compare
kw_per_ton_medianandpct_hours_inefficientinchiller_out/findings.jsonforPLANT__chiller_fouling_065,PLANT__chiller_fouling_095andPLANT__fault_free. - Other faults. Find the other runs
chiller_efficiencyflags, and look at the worst tower fouling,PLANT__coolingtower_fouling_065. - Score. Run
camber datasets scoreon the calibrated findings and read the per-detector rates and the list of which rule fired on which run.
Questions
- With the generic ceiling, what does CAMBER say about the fault-free plant? What true- and
false-positive rates does the score give
chiller_efficiency, and why is a detector that catches every fault still useless here? - With the calibrated ceiling, what does the fault-free chiller read, and why is that the right reference for this plant?
- How far do the two chiller-fouling runs move the kW/ton? Why does CAMBER flag one and not the other, and what in the finding still shows the milder one?
- Which other runs does the rule flag, and which fault barely moves the chiller's kW/ton at all? Where would you look for that one instead?
- What does the label score give
chiller_efficiencywith the calibrated ceiling, and which runs count as its false alarms?
What CAMBER shows
- Findings.
camber runprints one line per finding with its severity (fault,warn,ok) and the median kW/ton against the ceiling.findings.jsonholds the metrics:kw_per_ton_median,design_kw_per_ton,tons_median,load_factor_median_pctandpct_hours_inefficient(the share of loaded hours more than 15 % above the ceiling). - Severity bands.
warnfrom 1.2 times the ceiling,faultfrom 1.5 times, judged only on hours when the chiller draws power and makes at least 5 tons of cooling. - Score.
camber datasets scoreprints the true- and false-positive rates, with 95 % intervals, for the dataset's declared detectors, and which rules fired on each labelled run.
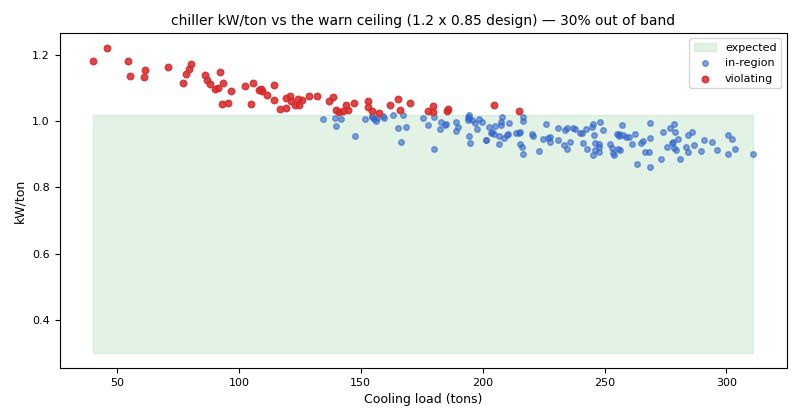
Synthetic illustration, not this exercise's dataset: kW/ton against load, drawn with CAMBER's diagnostic scatter and a band up to the rule's warn ceiling (1.2 times the 0.85 kW/ton design). The degraded chiller crosses it at part load.
Caveats
- The data are simulated. A real chiller's ceiling comes from its schedule (kW/ton at design and part load), or from its own commissioned, healthy operation, never from a generic number.
- Calibrating on the fault-free run assumes that run is healthy. On a real plant that is the claim to check first.
- The kW/ton is computed from the chilled-water flow and temperatures. A biased temperature sensor changes the computed tons, not only the power; see the sensor exercise.
- The chiller-fouling runs are in the archive but not in the dataset's inventory; their severity is read from the file names (see the data issues).
- One median over a year hides when the fouling started. A drift comparison against a baseline
period is the tool for that (
camber drift).
Going further
- Edit
chiller.jsonand try ceilings between the two: at what ceiling does the milder chiller fouling appear, and what else appears with it? - Open the report (
camber report chiller.json --out chiller.html) and compare the evidence for the two chiller-fouling runs. - Read the cooling-tower exercise for the fault this rule misses.