Terminal units: one bad box in a fleet
Workbook exercise zone-bad-box · PNNL re-tuning chapter 7 · about 45 minutes
Goal
Ten VAV boxes share one rooftop unit, and on six of seven test days one of them has its damper stuck. Find that box from the trends and from the zone cohort, see how the rooftop unit reacts to it, and find out how much a comfort rule alone can tell you. Then read the rule that judges the damper itself against what its room asked for, and see why the healthy boxes, whose dampers also sit still for hours, stay quiet. The published fault labels score both.
Learn more
Read this first (PNNL, free):
- Chapter 7: Terminal Units in Air Distribution System of the re-tuning training: what to trend on a terminal box, and what a box that does not respond to its controller looks like next to the ones that do.
Datasets and licence
ornl-frp-vav: a real two-storey test building at Oak Ridge National Laboratory: one rooftop unit and ten VAV boxes with electric reheat, logged every minute, one day per test scenario. Licence CC-BY-4.0 (open; cite it). The default subset is one 7.7 MB workbook (test set 3). The catalog lists the problems found in the published data and how CAMBER handles each: see its data issues.
Each test day becomes eleven pieces of equipment in the facility ds-ornl-frp-vav: the rooftop
unit RTU__d3_<day> and its boxes RTU_VAV_<room>__d3_<day>, for rooms 102–106 and 202–206.
The days are fault_free and one box's damper stuck at 0, 20, 40, 60, 80 and 100 %
(stuck_000 … stuck_100). The catalog's labels name the box under test; try to find it
before you look.
Setup
In the lab
- Run
camber laband open the URL it prints (http://127.0.0.1:8765/lab?token=...). - Tick
ornl-frp-vavand press Fetch & ingest (it needs CAMBER'sxlsxextra). - When the job is done, the row links to trends (the trend viewer) and report (the dataset's default config, the one this exercise uses).
On the command line
camber datasets fetch ornl-frp-vav
camber datasets ingest ornl-frp-vav --store lab_store
camber datasets config ornl-frp-vav --store lab_store --out vav.json
camber run vav.json --out vav_out
camber datasets score ornl-frp-vav --store lab_store --findings vav_out/findings.json
The exercise uses the dataset's own config. Among its rules:
actuator_stuckruns on every box. It is the dataset's declared detector: it finds the stretches where a damper holds one position, and judges each against the room's temperature and setpoints.unmet_setpoint_hoursruns on every box, as context.sat_rogue_zone_censusandsat_cohort_starvationread each day's ten boxes as one cohort under that day's rooftop unit. The grouping comes from the equipment names.
Its _comment lists the rules it leaves out, and why. Many are left out because no airflow
setpoint is logged.
Steps
- Look at the cohort. In the trend viewer, open the ten boxes of one faulted day (say
stuck_000) and compare their damper positions over the occupied hours (07:00–22:00). Which box does not move? Do the same on another day. - Compare the box with itself. Put the suspect box's airflow on the fault-free day next to its airflow on the 0 % and 100 % days. Then compare it with the other nine boxes on those days.
- Run the config (the commands above) and read the
unmet_setpoint_hoursfinding for the suspect box on each day. Then read itsactuator_stuckfinding each day: the severity, the summary, and thereasonandtiermetrics. - The cohort rules. Find
sat_rogue_zone_censusandsat_cohort_starvation(equipment<fleet>). Which box drags which day's supply-air reset? Is any day's whole cohort starved? - The rooftop unit. Open
RTU__d3_stuck_000…RTU__d3_stuck_100and compare their supply airflow and duct static pressure over the occupied hours. - Score. Run
camber datasets scoreon the findings.
Questions
- Which box is under test, and what in the trends gives it away on every faulted day?
- On the 0 % day and on the 100 % day, where does that box's airflow sit among its nine neighbours?
- On which days does
unmet_setpoint_hoursflag the box under test, and on which does it stay quiet? Explain the quiet days. - The box under test is flagged on the fault-free day too. What does that tell you about its room?
- What does the supply-air rogue-zone census say, and on which days? What does the cohort-starvation census add?
- How does the rooftop unit react as the stuck damper goes from shut to fully open?
- On which days does
actuator_stuckflag the box under test, and why is it a fault on some days and only a warning on others? Its neighbours' dampers also hold one position for hours: why are they not flagged? What label score does it get, and what wouldunmet_setpoint_hoursalone score (your answer to question 3)? Why is a comfort rule a poor stuck-damper detector here? - Room 102 is flagged on every day, whatever the test. Is that the fault under test?
What CAMBER shows
- Findings. One
actuator_stuckfinding per box per day (tier,reason,value,stuck_share, and every flagged run underroles), oneunmet_setpoint_hoursfinding per box per day (unmet_pct,too_hot_pct,too_cold_pct), and one<fleet>finding for each census. The rogue-zone census listsrogue_by_group(the rogue box of each day's rooftop unit) andzone_request_share. - Trends. The trend viewer shows every box's damper, airflow, room temperature and setpoints, and the rooftop unit's airflow and static pressure.
- Score.
camber datasets scoreprints the rates for the declared detector (actuator_stuck→ stuck damper), scoring only the box under test on each day.
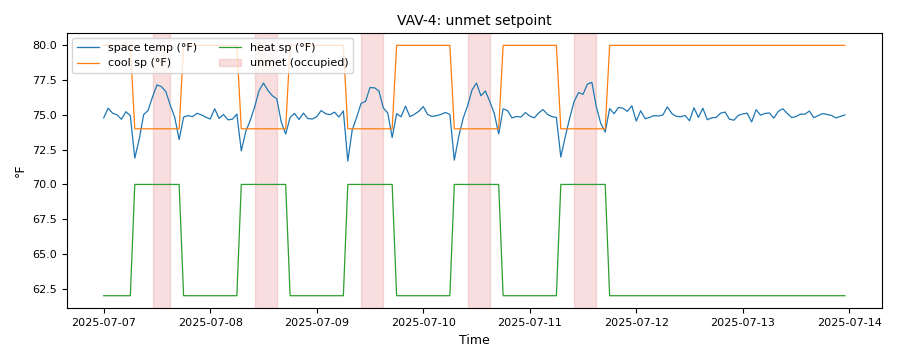
Synthetic illustration, not this exercise's dataset: the unmet_setpoint_hours evidence trend for a box whose damper is stuck at 30 %. Shaded spans are the occupied hours the zone ran over its cooling setpoint.
Caveats
- Every scenario is a different day, with different weather. Comparing a box across days mixes the fault with the weather; comparing it with its neighbours on the same day does not.
- The ten rooms differ in size and load, so their airflows differ even when every box is healthy. Compare shapes (a flat damper) and ranks, not raw values.
- The reheat is electric and logged as energy, not as a valve, so no reheat rule can run here
(see
zone-reheat-saturated). - The rooftop unit's reaction is read from its own trends, one day per position, so it carries the weather differences too.
- No airflow setpoint is logged, so
airflow_tracking(the rule that finds stuck dampers onlbnl-fpu) cannot run.
Going further
- The
fullsubset (camber datasets ingest ornl-frp-vav --subset full --store lab_store) adds test sets 1 and 2 (the box of rooms 106 and 104 under test) and two airflow-sensor-bias sets. Doesactuator_stuckfind the box under test in each set? Look closely at set 1's 100 % day. - Copy
vav.jsonand addcohort_airflowto its rules with"params": {"group_by_topology": true}, so each day's ten boxes are compared only with each other. Does the raw mean airflow pick out the stuck box? Try"normalise": "design_max"with a"design_max"map of each box's largest airflow, then a cohort on the damper itself (in Python:CohortDeviation(Role.DAMPER, group_by_topology=True, summary="variability", tail="low")). Which comparison isolates the stuck box, and why does evening out the box sizes not?